The Conundrum of iTunes' Recognition of Revenues

An excerpt from a report titled “iTunes Business Review” which I’m currently writing:

Revenue Recognition

Before proceeding it’s also important to understand one more detail: The company does not report all transactions through iTunes as revenue. To quote the 2012 Annual Report (10 K):

For third-party applications sold through the App Store and Mac App Store and certain digital content sold through the iTunes Store, the Company does not determine the selling price of the products and is not the primary obligor to the customer. Therefore, the Company accounts for such sales on a net basis by recognizing in net sales only the commission it retains from each sale. The portion of the gross amount billed to customers that is remitted by the Company to third-party app developers and certain digital content owners is not reflected in the Company’s Consolidated Statements of Operations.

What this means is that App revenues are only reported at the 30% level that is retained by Apple. The 70% paid to developers is excluded from Apple’s financial reports. The same is true for other products for which it considers to be acting as an agent. The difference seems to be mostly in cases where Apple does not define the end user pricing. This is mostly true for ebooks however that may not be true for all book titles.

This distinction between “gross” revenues and “reported” revenues is maintained in this report but both are presented for consideration. Gross revenues are needed for comparing the media businesses against each other and for competitive assessment but reported revenues are needed to test assumptions against ground truth.

This can be explained with an example:

If a song sells for 99c then Apple reports all 99c as Revenue and then pays the record company about 70c and uses 30c to operate the store and pay for transaction costs. In the case of music it means the Gross Revenue is 99c and the Reported Revenue is also 99c.

However, if an app sells for 99c then Apple reports only about 30c as Revenue. It does not consider the portion paid to developers as revenues for itself. It spends a portion of the 30c to pay for transactions, hosting, and the time testing and accepting the apps. In the case of apps and books it means the Gross Revenue is 99c and the Reported Revenue is 30c.

So if Apple sells one song and one app then the Consolidated Gross Revenue is 2 x 99c or $1.98 but the Consolidated Reported Revenue is only $1.29 (99c + 30c).

The difference in accounting is sometimes called “agency” vs. “wholesale” and it applies in some retail businesses. Another term sometimes used for used goods is selling items “on consignment“.

The reasoning for why some media are treated one way or another is cited in the Annual report as “the Company does not determine the selling price of the products and is not the primary obligor to the customer”. In the case of Apps, the price is set by the developer and the developer is obligated to deliver on the promise. Apple acts as transaction processor and they don’t consider that they ever owned (and hence never sold) the app. Note that this accounting is probably discretionary. They decided to do it this way and it’s not clear that it was necessary to do it this way by any regulation.

This distinction between two treatments of revenue makes it difficult to understand the complete story behind iTunes.

If you’re interested in the full report, contact me directly.

UPDATE:

Apple’s rationale can be partly justified from a reading of a Financial Accounting Standards Board statement titled “Reporting Revenue Gross as a Principal versus Net as an Agent” (Emerging Issues Task Force Abstract EITF 99-19 http://www.fasb.org/pdf/abs99-19.pdf) a portion of which is quoted below.

“Indicators of Net Revenue Reporting

15. The supplier (not the company) is the primary obligor in the arrangement— Whether a supplier or a company is responsible for providing the product or service desired by a customer is a strong indicator of the company’s role in the transaction. If a supplier (and not the company) is responsible for fulfillment, including the acceptability of the product(s) or service(s) ordered or purchased by a customer, that fact may indicate that the company does not have risks and rewards as principal in the transaction and that it should record revenue net based on the amount retained (that is, the amount billed to the customer less the amount paid to a supplier). Representations (written or otherwise) made by a company during marketing and the terms of the sales contract generally will provide evidence as to a customer’s understanding of whether the company or the supplier is responsible for fulfilling the ordered product or service.


New Padcast: The Ecosystem Wars and the Factory

Screen Shot 2013-03-10 at 3-10-11.05.14 PM

2013 will see two billion phones shipped to over 4 billion consumers. Contrary to the common assumption that larger markets sustain more competitors, this rapidly growing market is profitable for only two device vendors. Horace Dediu seeks answers to this paradox at the Harvard Business School Technology and Operations Management Digital Seminar Series. Self-recorded live on March 7, 2013, 45mins, 22.5Mb.

Download for iPad and iPhone: here. Requires Perspective app from Pixxa.

Interview with Anouch Seydtaghia of Le Temps regarding the Galaxy S4

This interview took place on the eve of the launch of the Galaxy S4. Anouch Seydtaghia is Deputy Head of the Economic & Finance Section chez Le Temps Geneva, Switzerland.

Q: How can you explain that Samsung organizes such a huge event in NY for the S4?

A: The S4 is a very important product as it’s probably the second most profitable mobile phone in the world. Samsung is trying to position it as a premium product and is using every means available to do so.

What are your thoughts about the huge marketing budget of Samsung?

Samsung’s marketing budget has been a constant percent of their sales (approximately). As sales have risen, the budget has risen. This is not considered a normal situation if sales grow very rapidly but Samsung seems to consider x% of sales to be appropriate spending level. Note that Apple’s marketing has fallen as a percent of sales while its sales have grown dramatically.

If we read the media, we see a lot of speculation about the features of the future S4. Can we now compare that to the expectations before a new iPhone?

There are speculations about all phones, from Nokia to HTC and BlackBerry. I don’t see the speculation to be different between all the major companies.

Can Apple regain the lead in the smartphone market? If yes, how?

Continue reading “Interview with Anouch Seydtaghia of Le Temps regarding the Galaxy S4”

An update on Android activations

Two days after I posted a reminder that Google had not updated their Android activations for five months, Google updated their Android activations.

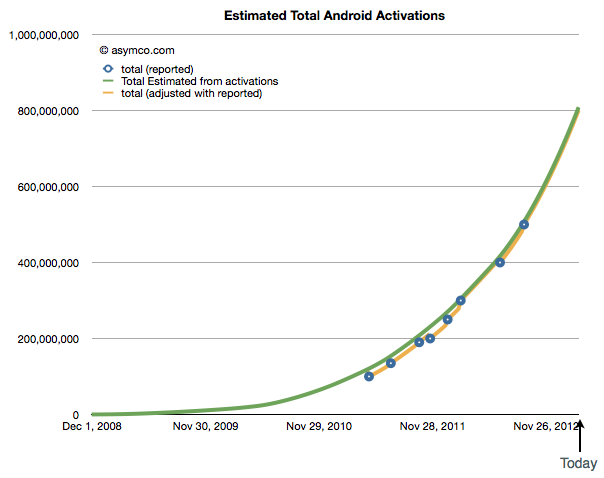
The new total is 750 million. My expectation (based on a rate of activation acceleration of 30,000 activations/day/week) was 800 million. Google did not update their download rate but it can be derived. Between September and March the average has been about 1.4 million/day. I had previously estimated that the rate of activation was 2 million/day.

This is a modest increase from the 1.3 million/day that was reported in September implying that activation acceleration has slowed.

After resetting the acceleration to 5,000 activations/day/week my new forecast for 1 billion activations moves to the end of August.

Coincident with this update on activations, Google reported that Andy Rubin has stepped aside as the head of Android and that Android and Chrome would be under the same management.

Putting aside the exit of the founder, the implications of the merger with Chrome will need significant contemplation.

Where are the Android users?

Google occasionally reports data regarding Android. Very occasionally. The last time we had some data was in September 2012 when we learned that activations were running at 1.3 million per day and that a total of 500 million total activations had taken place.

As of today, being March 2013, the time between updates has reached five months. It’s the longest gap so far. Benedict Evans also notes that it’s been five months since the data regarding screen size stats has been updated on the Android developer site.

But we have to live with what we get and, in the absence of an update, the pattern of growth in Android, if sustained, looks like this:

Screen Shot 2013-03-10 at 3-10-11.05.14 PM

Continue reading “Where are the Android users?”

Reminder: Giving a talk at Harvard Business School this week

This is a reminder that I’ll be speaking at the Harvard Business School Technology and Operations Management Digital Seminar Series on ”The evolution of value chains in a computing markets measured in the billions of units per year.”

For the abstract see this post.

When: It’s taking place at 3:00 PM on Thursday March 7th.

Who can attend: The talk is open to the public, seating is limited.

Location: The Cotting House on the campus of the Harvard Business School (map linked), Boston. There is parking in the main lot with entrance across from the Harvard Stadium for $14/day.


The Critical Path #75: Bigger Than US Steel

5by5 | The Critical Path #75: Bigger Than US Steel.

New data allows us to estimate the components of iTunes with more precision. The entire business is now transacting over $17 billion a year. We take a look at how this insight can be gained and what it means for the future of commercial media.


Measuring the iBook market

In June of 2011 Apple announced that 130 million ebooks were sold through iTunes. In October of 2012 it announced that 400 million sold.

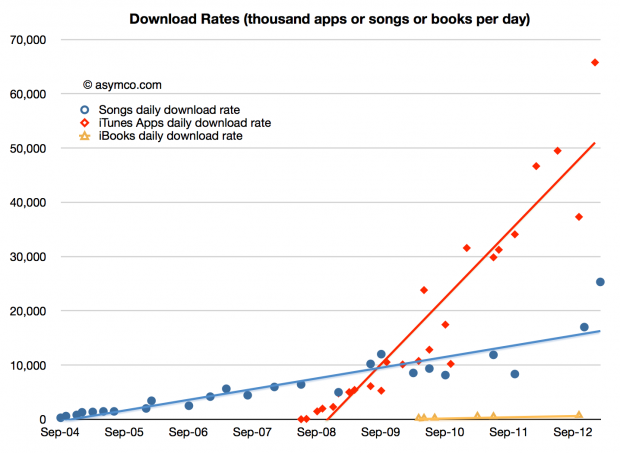
That means 270 million ebooks were sold in 16 months. Or about 17 million units per month, on average. It also suggests 2012 ebook sales of about 200 million units.[1] The following graph shows the download rate of books relative to apps and songs:

Screen Shot 2013-02-28 at 2-28-3.09.25 PM

The download rate looks paltry but we need to remember that Apps have a very low average selling price (about 23 cents including in-app purchases) and that Songs are probably priced around $1.1 on average. In contrast each ebook could be generating about $10 per download. Continue reading “Measuring the iBook market”

LG's new Tele-vision

LG Electronics has acquired HP’s WebOS for an undisclosed amount. When last it changed hands WebOS was part of Palm which was purchased for $1.2 billion in 2010.

Palm has thus been effectively divided into several smaller pieces distributed as follows:

HP will own:

  • Support of existing Palm users
  • Palm back-end assets including source code, infrastructure and talent
  • webOS patents

LG will own:

  • Stewardship of the Open WebOS and Enyo open-source projects where the source code resides
  • Associated talent
  • WebOS websites
  • License for IP related to webOS

LG announced that it plans to offer an “intuitive user experience an Internet services across a range of consumer electronics devices.” In an interview, the CTO of LG said that given the current situation with Android, LG does not plan on making smartphones running webOS but will use it in televisions and other devices such as cars, signage and appliances where there are no embedded OS’s. “We’d like to secure a software platform across all devices.” Continue reading “LG's new Tele-vision”