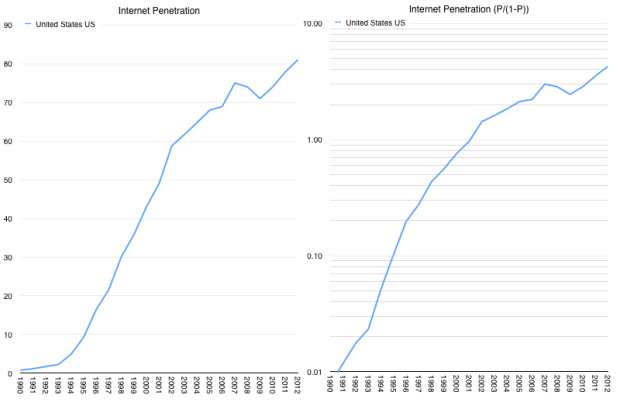
According to ITU data, Internet usage reached about 2.2% penetration in the US (2.2 users per 100 residents) in 1993. The figure in 2012 was 81%. The history of penetration is shown in the following graphs.
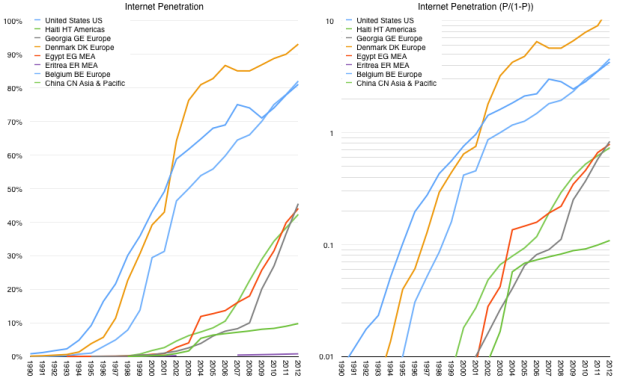
Similar graphs can be drawn for other countries (data is available for 193 countries/territories.) I chose the following set of countries arbitrarily:
When looking at all countries, the patterns are fairly self-evident. They nearly all behave the same way with respect to the impulse to move online. The pattern is approximately logistic (observed as linearity in the right-side graphs).1 The main difference is one of timing.
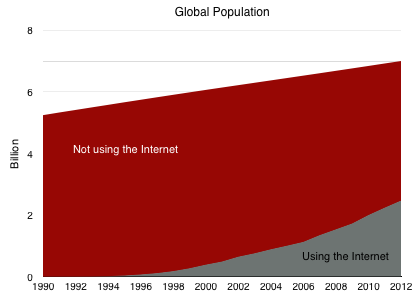
The global picture should therefore not be surprising. In absolute terms, the penetration was 35% at the end of 2012 or 2.5 billion individuals. The graph of global population divided into Internet consumers and Internet non-consumers is shown below followed by penetration.
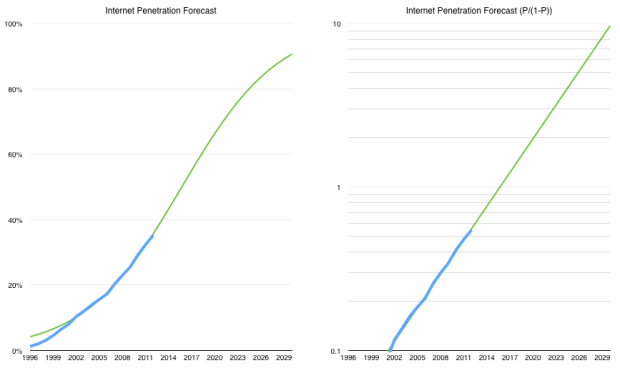
The linearity in the blue line above is consistent after 9% penetration is reached (P/(1-P) ~= 0.1) suggesting logistic growth (far more smoothly than individual country data). Note that I also took the step of projecting the logistic curve that describes the internet’s growth forward a few years.
Based on this history, it becomes possible to project that 2013 penetration reached around 39% or 2.78 billion individual users.
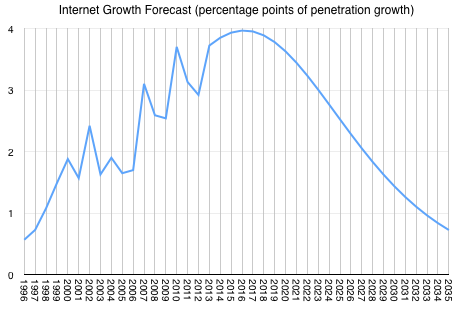
It also suggests that “saturation” could come between 2030 and 2035.2
If we look at growth,3 the inflection point comes in 2016. Thereafter internet user growth will slow.
Overall, the growth pulse of the Internet will be approximately 40 years long.4 We are therefore nearly half-way through.
It might seem an interesting but benign fact, however I must caution that as we’ve seen with smartphones, once the point of inflection is reached, investors tend to flee the sector. That in itself may not be a bad thing but investment flight has deep effects on “ecosystem” participants.
Venture investments tend to feed entrants disproportionately and they are remarkably sensitive to the valuations of public companies (and IPOs). These investment might therefore be in danger in two years. Plan accordingly.
- Those that don’t are anomalies which should be inspected individually and might provide insights into the constraints for systemic state health. [↩]
- The curve is defined as having a half-period of 19.7 years from 1996 [↩]
- Derivative of logistic curve [↩]
- More likely 35 years as saturation dynamics will be erratic. [↩]
Discover more from Asymco
Subscribe to get the latest posts sent to your email.

