
In October 2013, at the end of its last fiscal quarter, Apple stated:
The Company’s capital expenditures were $7.0 billion during 2013, consisting of $499 million for retail store facilities and $6.5 billion for other capital expenditures, including product tooling and manufacturing process equipment, and other corporate facilities and infrastructure. The Company’s actual cash payments for capital expenditures during 2013 were $8.2 billion.
The Company anticipates utilizing approximately $11.0 billion for capital expenditures during 2014, including approximately $550 million for retail store facilities and approximately $10.5 billion for other capital expenditures, including product tooling and manufacturing process equipment, and corporate facilities and infrastructure, including information systems hardware, software and enhancements.
These 10K (fiscal year annual) forecast figures for capital expenditures are shown in the following graph. Note that they also include the fiscal years from 2006 to 2012. Note also that the graph includes the actual expenditures (in green).
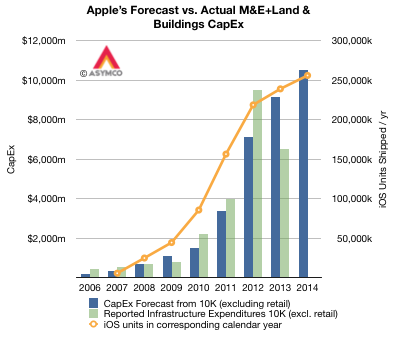
From 2006 through 2013 the sum of the forecasts was $23.445 billion while the sum of the expenditures were $24.662 billion. With the exception of a carry-forward in 2012, the forecasts are broadly in-line with expenditures, with about 5% more spent than forecast.
This pattern of accuracy in spending makes a $10.5 billion expenditure during the current fiscal year believable. In other words, taking the forecast at face value, and given that three quarters of the fiscal year have already passed, what does it imply for the current and last quarter? The following graph shows what Q3 spending should be relative to previous quarters (and 2011, 2012 and 2013).
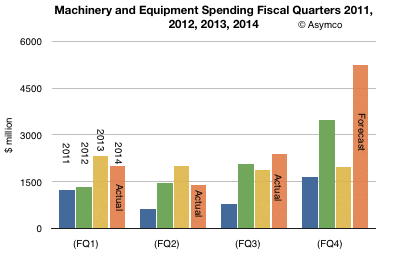
The FQ4 (CQ3) “budget” for PP&E should therefore be $5.255 billion. This would be the most Apple has ever spent on PP&E in a single quarter.
Shown another way, each fiscal year’s spending from 2008 to present looks like this:
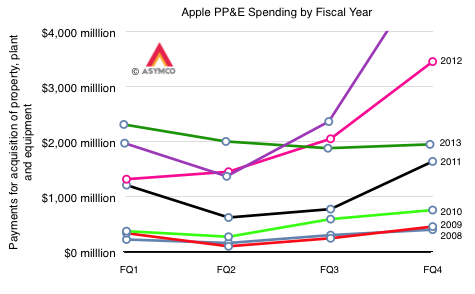
2014 is shaping up to be a bigger “ramp” in spending than any previous year. We have also noted how iOS device shipments correspond to these CapEx figure.
The relationship is shown in the first graph. I super-imposed iOS unit shipments for the calendar years because capital expenditures tend to result in production in the following quarter and Apple’s fiscal year is shifted one quarter earlier than the calendar year. The iOS units shown for 2014 is based on shipments to date and a forecast of shipments for Q3 that is in-line with company guidance1 and a modest forecast for Q4.
The metric of Capital Expenditures (excluding retail) is a good “rule-of-thumb” for predicting iOS growth, but it’s not perfect. Obviously we’ve seen issues between forecasts and actual spending on a quarterly basis, but there is an overall relationship which makes sense: Apple spends on tooling and infrastructure in terms of data centers to support iOS growth. So far, a growth in CapEx has resulted in a growth in iOS.
It’s therefore reasonable to assume that calendar 2014 will see at least 250 million iOS devices sold. How much that figure will vary will depend to some degree on the confluence and substance of product announcements this fall.2
- 37.2 million iPhones, 14 million iPads, 1.9 million iPods touch which result in net sales of $40.18 billion and corresponds to the top of the guidance range of $37 to $40 billion [↩]
- My best guess is now 255.8 million. [↩]
Discover more from Asymco
Subscribe to get the latest posts sent to your email.