
Unicorns typically are valued on the basis of number of users. While they are not yet monetizing those users, their growth and engagement metrics are expected to be off the charts. As there are no revenues (or profits) the $billion valuation hinges on a nominal value of $/user. That figure is based on comparable companies (e.g. Facebook) which do monetize their users.
Since the unicorn’s capitalization/user defines its valuation, which company should be considered comparable? Unfortunately they range widely. There are many alternatives. The graph below shows a few Market Cap/Mobile User rates ranging from $45 for Yelp to $747 for Alibaba.
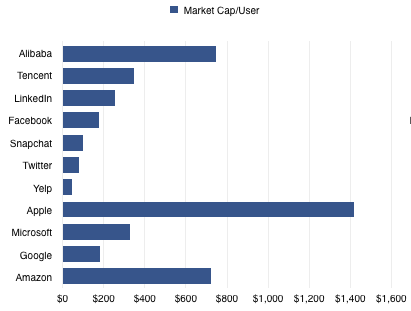
Note that I’ve also added companies which may not be considered as unicorn comparables because they are not usually valued on a per-user basis. Apple, Microsoft, Google and Amazon are priced by product sales, typically. However, most of them operate and self-define as service organizations. Microsoft has been “monetizing users” for decades using a recurring revenue model. It has a “SaaS” business logic for most of its revenues. Google1 likewise. Amazon reports its active users every quarter and obviously is measuring itself by that metric.
Apple2 is the least likely to be seen as a company whose value is a function of user base. Nonetheless it behaves entirely on that basis. The company’s entire strategy depends on satisfying its customers and building its brand which can only have one outcome: loyalty and repeat purchases. The services and software they offer can be seen as supporting that brand loyalty which is converted to profit through an above-average selling price.
Being mature of business model therefore does not exclude a company from being valued like all the kids are these days.
So, if we do look at the value/user metric we might as well look at the revenues, operating profit and growth data.
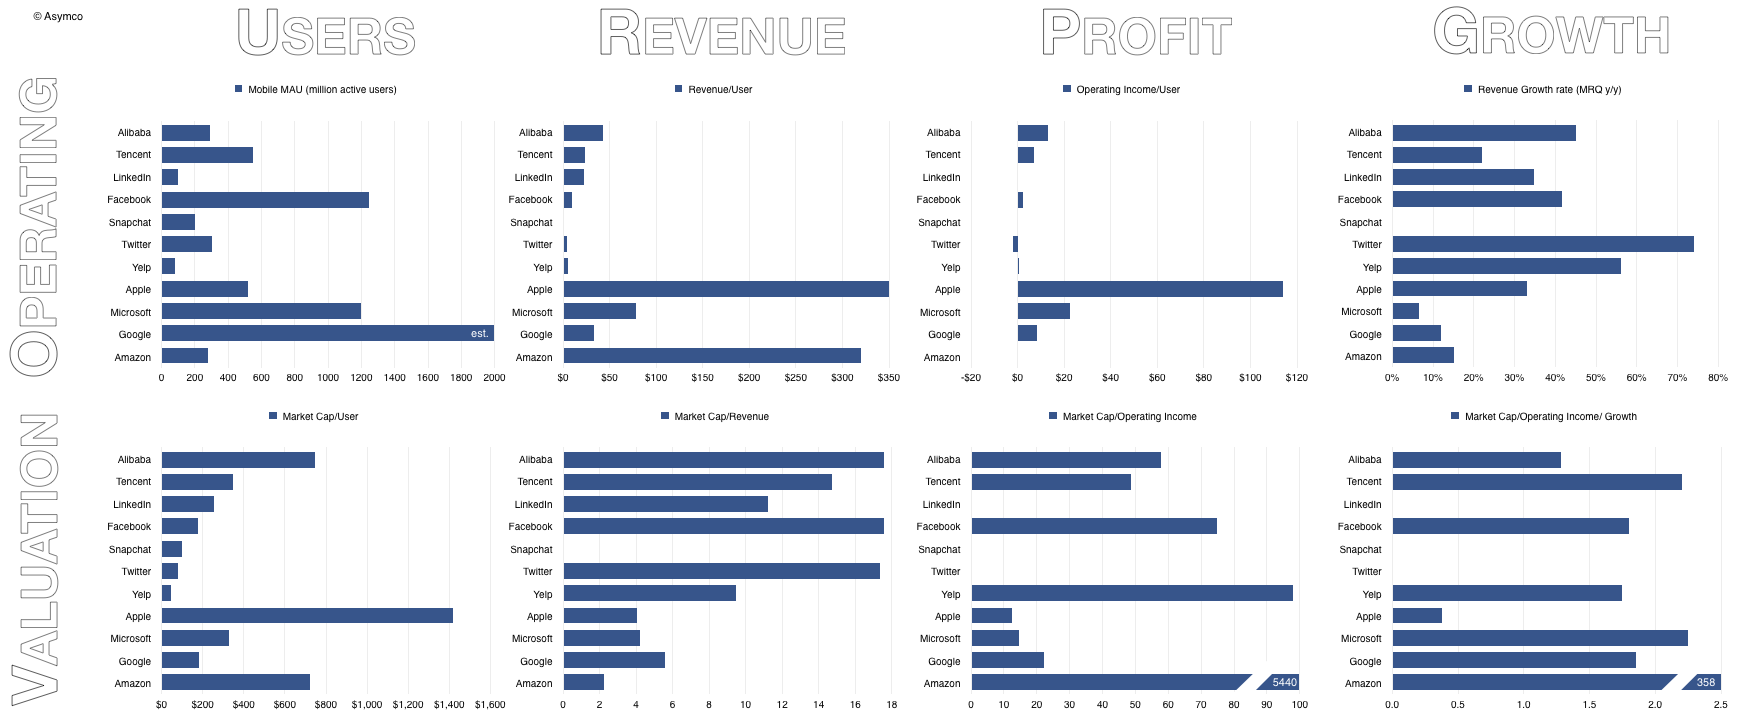
Unicorns are therefore characterized as having negligible revenue or profit but significant growth. The growth of Alibaba, Tencent, LinkedIn, Facebook, Twitter, Snapchat and Yelp should be seen in the 50% y/y range. The growth of mature companies is more modest: Microsoft (<10%), Google (12%), Amazon (15%).
Apple is an exception with recent growth in the 30% to 40% range.
Markets therefore value internet services at multiples of 10 to 20x revenues and 50x at least in terms of operating income. These multiples don’t yet apply to Unicorns, since they typically don’t have revenues, but the expectations are typically in this range once they do.
Mature product companies are valued more cheaply with 2x revenues for Amazon (a retailer with zero margins) up to Google with near 6x. Apple and Microsoft are in the middle at 4x revenues.
Mature company value as a function of income is also much lower ranking from about 12 for Apple to 22 for Google. Amazon’s multiple is astronomical only because it has almost zero income.
Finally, when considering growth and income together3 both emerging services and product companies are priced between 1.3 and 2.5. The outliers are Amazon due to its lack of income (PETG of 358) and Apple with its enormous income (PETG of 0.4).
This last ratio has had a “rule of thumb” of 1.0 being the “fair value” with <1 being seen as under-valued for growth and >1 being over-valued. Alternatively it can be seen as either pessimism about sustainability or optimism, respectively.
Clearly Unicorn Mania (or Unicornia) is a reflection of an optimism around new market disruptions in many industries where software has suddenly become ingestible. Old-school software companies are seen as less exciting in this context. If only they could take part in these new market creating opportunities then maybe they too could benefit from this optimism.
Now that would be crazy talk.
- Google users are estimated at 2 billion active Android/GMS devices [↩]
- The assumption here is that Apple has 520 million active users which is based on iOS devices in use estimates [↩]
- When seen into the future this is the PEG ratio or Share Price/Earnings/Growth. When seen into the past, this is the PETG or Share Price/Earnings/Trailing Growth [↩]
Discover more from Asymco
Subscribe to get the latest posts sent to your email.