
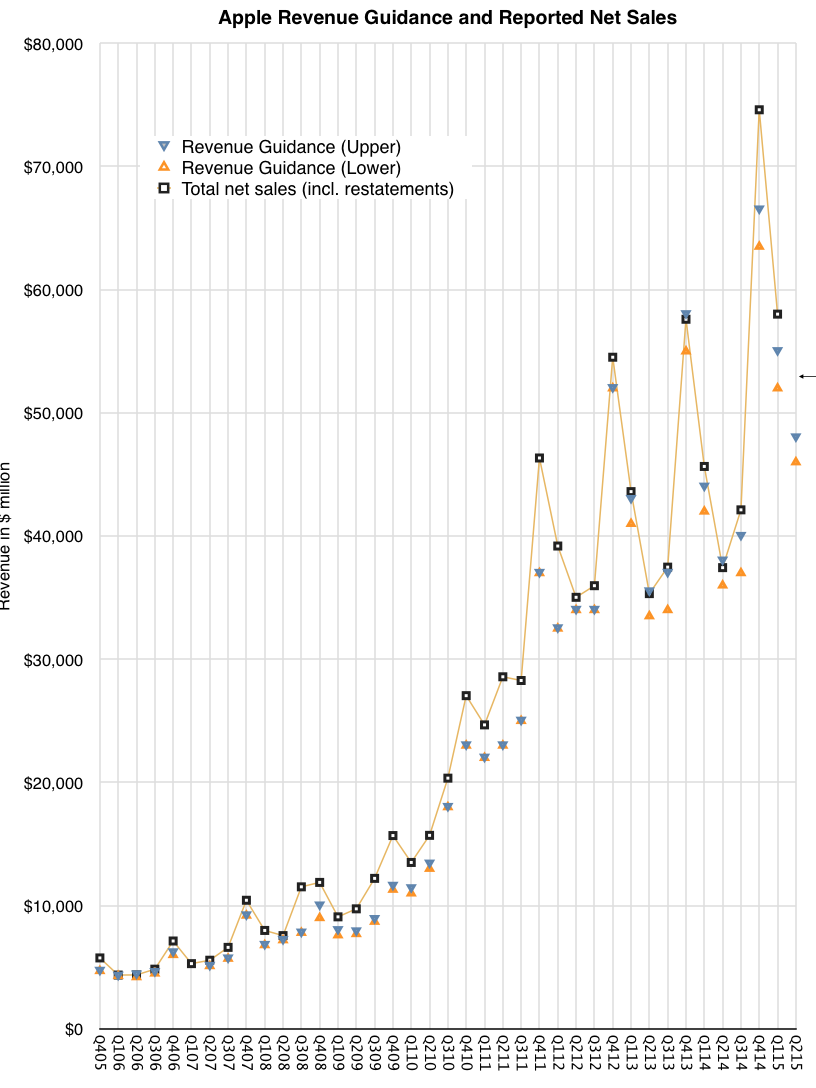
For the first time in many years I feel that there is some potential uncertainty in the results Apple will announce. After a period of excellent accuracy (shown in graph below), the company’s guidance has begun to diverge dramatically from reality and the trend might continue this quarter. The cause might be unanticipated demand for the iPhone 6/6 Plus. The growth rate for the product was 46% in Q4 and 40% in Q1. This is unanticipated because growth rates have been below 20% for five quarters and below 50% for eight.
This slowing of growth was explainable given the rate of diffusion of smartphones in the global population. Within the US and some other early adopting economies the market is reaching late stages where most people have switched to smartphones. Globally we are at a more modest 30% or so but in many of the late adopting economies Apple does not have wide distribution.
Of course this thesis is thinly supported. There are many reasons to think that late adopters would still start with iPhone and that earlier adopters of Android would upgrade to iPhone after a few purchase cycles. Thus, the iPhone could prosper in later-adoption or even in post-saturation states of the market.
Indeed, in the post-saturation PC market, Apple is doing very well with the Mac and in the late to post-saturation MP3 player market the iPod did extremely well. This suggests that when it comes to value capture brand, experience and satisfaction trump function, price and share considerations in almost all consumer markets1
With so many assumptions put asunder the iPhone business suddenly looks downright lively. I adjusted my own growth assumptions and the resulting figures are shown below.
| F3Q15 | Daniel Tello | Horace Dediu | |
| iPhone | Units |
51.0 |
52.8 |
| Price |
626 |
645 |
|
| Revenues |
31925 |
34059 |
|
| iPad | Units |
10.0 |
10.6 |
| Price |
428 |
430 |
|
| Revenues |
4280 |
4567 |
|
| Mac | Units |
4.95 |
4.94 |
| Price |
1240 |
1240 |
|
| Revenues |
6136 |
6129 |
|
| Services | Revenues |
5006 |
5196 |
| Other | Revenues |
3902 |
3092 |
| Total | Revenues |
51249 |
53043 |
| COGS |
30577 |
31766 |
|
| GM |
40.3% |
40.1% |
|
| OpEx |
5733 |
5789 |
|
| OpInc |
14939 |
15488 |
|
| OI&E |
357 |
350 |
|
| Pre-tax |
15296 |
15838 |
|
| Tax |
4023 |
4165 |
|
| NetInc |
11273 |
11673 |
|
| Shares |
5779 |
5780 |
|
| EPS |
1.95 |
2.02 |
I include for comparison Daniel Tello’s forecast as his work carries quite a bit of thoughtful analysis.
The upshot of this is that the company is poised to grow earnings per share at a rate of at least 50%!
That growth rate is astronomical, especially for what is already, by far, the world’s biggest company by market capitalization.
This was not supposed to happen because of a so-called “law of large numbers.” The “law” is actually a probability theorem which states that the average of experimental results should be close to the expected value given sufficiently large number of experiments. The way it’s applied in market analysis (I assume) is that “no company can perform above market average performance for a sufficiently long time”.
It implies that there can be no outliers and that all companies “revert to the mean because …”
Actually, I don’t have any idea why they might. The premise that all companies are the same must play into this but companies can only be alike if they have the same processes, priorities and resources. As long as I’ve been able to observe and as much as I’ve ever read on the subject I have never encountered any two which had anything in common.
And so the law of large numbers, as applied to market performance is a myth. It is easily disproved with a simple deconstruction into the causes of firm performance, but the empirical data from Apple alone shows how foolish it is to believe it.
- Enabled by design for jobs to be done. See non-technology markets for abundant evidence of this. [↩]