
Apple is categorized as a vendor of consumer electronics. More specifically, a member of the “Electronic Equipment” industry in the “Consumer Goods” sector. If indeed this is what it’s thought to be selling, there is a problem because it isn’t what its customers are buying.
Apple’s customers buy a mix of hardware, software and services under a brand that assures a certain quality of experience. This bundling and integration of otherwise disparate things is why the brand is such a success.
This anomaly between what Apple is thought to sell and what buyers actually buy can leave the casual observer confused. As a result the company’s categorization as vendor of hardware deeply discounts its shares. It is, in other words a less valuable business. This is because a seller of consumer electronics does not benefit from “system valuation” since there is minimal loyalty to the product after the sale.
The consumer electronics vendor has no network to leverage, no ecosystem adding value after the sale, no platform and works through multiple levels of distribution to reach the customer. In contrast, a system vendor can expect benefits from network effects, ecosystems, and a coveted relationship with the end user.
The result is that the valuation of a consumer electronics vendor is based on the momentum of individual products. Apple has always been valued this way. Each hit product is considered to be a stroke of luck/genius and the chances of recurring are discounted to about zero. Regardless of the fact that it has a track record of “home runs”, Apple’s hit rate is not considered sustainable.1. Certainly Apple is not valued as being able to generate reliably recurring revenues.
But what if we were to value Apple on the basis of what people are buying rather than what it’s thought to be selling?
The model is simple enough: determine the number of users, estimate the lifespan of the products, and figure out the services attached to the products; then, given the price, obtain a price per product per day. You then can get a recurring revenue figure.
I did just that and the results are in the following table:
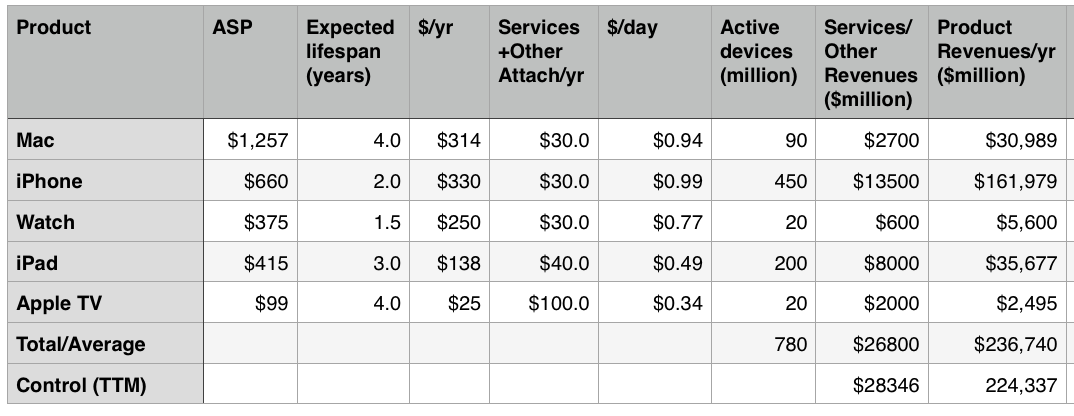
The first column is the product, the second is the Average Selling Price (ASP), the third is the expected lifespan of the product, and the fourth column is a calculation of the end user’s “spending per year” on the product.
The fifth column is an estimate of the revenues from Apple’s Services and “Other” groups from post-sale revenues attached to the product. This Services revenue includes AppleCare, iCloud, Music, App Store, other stores, Beats, accessories, iAd, and Made for i (MFI) licensing. It also includes Google traffic acquisition revenues and other licensing.
The sixth column is an estimate of the consumer “spend per day” on Apple’s product lines taking into consideration Services.
The seventh column is an estimate of the number of active devices in the hands of users. Note that these are expected to change over time.
The eighth column is a calculation of Services/Other income on a per-product allocation. This is a test of the Services+Other estimate and is meant to sum to nearly what Apple currently reports as Services+Other revenues.
The ninth column is a test of overall revenues on a per-product allocation. This should add up to total revenues (estimated for next year.)2
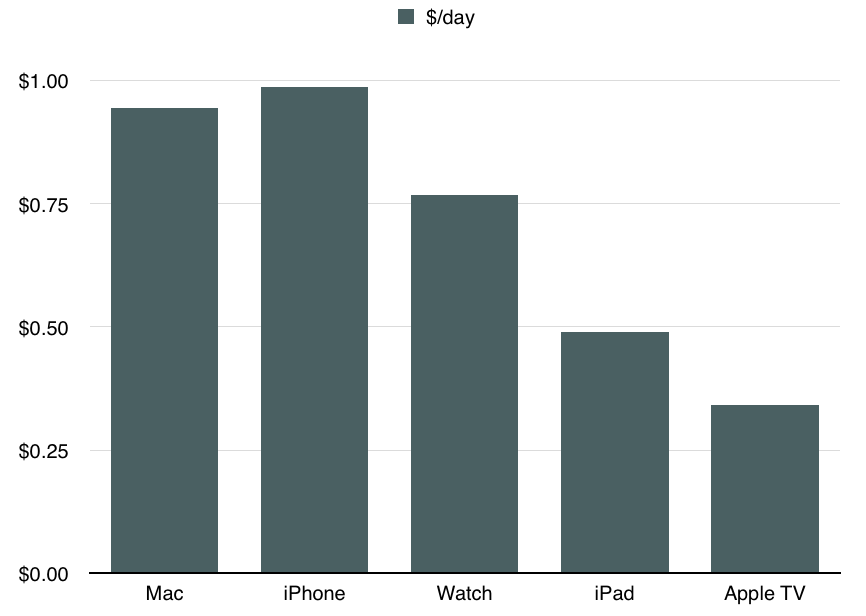
The bottom line is the following graph which shows the revenue per device per day inclusive of Services and Other income (The sixth column).
This is, in my opinion, a reasonable way to approach valuation of Apple as a business. It’s also a way to inspect its strategy.
As a valuation we can easily obtain the net present value. The model gives us sales and by estimating a net margin (which is remarkably steady around 22%) we can get the free cash flow.Iterate into perpetuity with a discount rate, and you can get the net present value of the company. With a modest growth rate leading to a billion active devices in use and a normalized revenue per device of $0.92 you can easily see cash flows equivalent to $1 trillion in present value.
But much more interesting than this value is the notion that Apple is in business to deliver a product/service mix to loyal customers and to preserve their loyalty through constant improvement and innovation. You can see strategic intent in increasing the attach rate of services per device. You can see a strategic intent in building loyalty and the right customer base which is likely to be loyal. You can see strategic intent in the iteration of the product in a way that extends loyalty and expands the solid base but also increases the $/day rate. This analysis correctly informs almost all decisions the company makes.
What we just saw in the launch of a new Apple TV and a new iPad is consistent with this strategy. Apple TV will have a higher service attach rate with apps while keeping pricing well below consoles thus expanding the user base. The iPad is increasing in price and getting more accessories. The developers are encouraged to build richer and more valuable apps that are uniquely enabled by the new device.
The fact that Apple has just launched a subscription service for the iPhone makes what was clearly their strategy all along plain to see however it has been a strategy in effect for decades.
It isn’t a difficult idea to embrace. It always surprises me that it’s not more commonly held. The reason may be that Apple is mis-categorized.
Or perhaps the entire categorization of industries and sectors is obsolete in what is a new post-industrial age. Some have figured this out already. Others will take longer.