
Three months ago Apple provided the following guidance:
As we move ahead into the June quarter,[…] We expect revenue to be between $51.5 billion and $53.5 billion. We expect gross margin to be between 38% and 38.5%. We expect OpEx to be between $7.7 billion and $7.8 billion. We expect OI&E to be about $400 million. And we expect our tax rate to be about 14.5%.
If we aim for a revenue figure close to the upper end of the range ($53.2 billion) and insert all the other figures (split the difference for OpEx) then then the company’s fiscal third quarter looks as follows:
Revenues: $53.2b
iPhone (units): 43.2 million
iPad (units): 11.6 million
Mac (units): 4.3 million
Services ($): 9.5 billion
Other products ($): 3.5 billion
Gross margin (%): 38.6%
EPS ($): $2.26
This last figure, the earnings per share, is the most speculative because it depends on another guidance that Apple gave: a new $100 billion share repurchase authorization and the fact that it has no time frame. For context, as of end of March the company had completed over $275 billion of its previous $300 billion capital return program and $10 billion remained for share re-purchases in the June quarter. It’s unclear how much of the new authorization will be spent in the quarter.
That spending could indicate the share count but there are issues with this calculation as well. The $2.26 EPS I forecast is based on the assumption that the the same number of shares will be retired as in the previous quarter (about 89 million shares.) However the company spent $23.5 billion on repurchases of 137 million Apple shares through open market transactions (for an average price or $171.53, in-line with the quarter’s trading average).
So why is the number of shares purchased (137 million) so different from the change in shares used to compute earnings per share (89 million)? I actually don’t know.
The question of how many shares are available to calculating EPS is perhaps the last mystery in what is otherwise a very predictable business. The revenue growth and implied iPhone growth are pretty transparent. Incidentally, the EPS I’m forecasting is equivalent to growth of 35.8% y/y. The share price is trading at multiples about half of this growth rate so it’s no wonder the company is spending most of the cash on re-purchases.
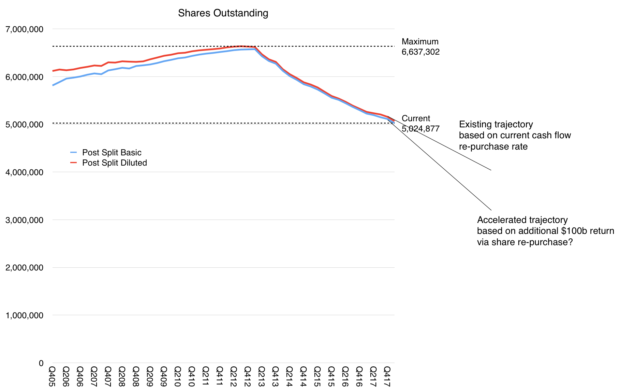
How quickly the $100 billion re-purchasing authorization will be used is another question. The effect in concentration of value per share could be profound as shown in the graph above which will have further implications on the “cash zero” direction for the company.