
For the last two years I’ve been studying the transportation economy and introducing the idea of Micromobility. Simply, Micromobility promises to have the same effect on mobility as microcomputing had on computing. Bringing transportation to many more and allowing them to travel further and faster. I use the term micromobility precisely because of the connotation with computing and the expansion of consumption but also because it focuses on the vehicle rather than the service. The vehicle is small, the service is vast.1
One of the elements of analysis for Micromobility is the notion of Unit Economics. The idea is that each vehicle can be seen as an independent business. It requires an investment, has a revenue attached, requires operating costs and fixed costs and finally, hopefully, generates earnings. A fleet’s economics is therefore a multiplication of the unit economics by the fleet size. A similar partial construct exists for mobile network operators where the network revenue is defined by ARPU (average revenue per user). In consumer hardware we also have the idea of ASP (average sales price) and BOM (bill of materials) which describe the revenue and variable cost of each device.
In the case of Micromobility the unit economics is more broadly applied in being an entire P/L statement for each vehicle. One example for the e-scooter sharing company Bird is here. If the unit economics of Bird is consistent across geography and time then the entire business can be valued based on one “average unit”. Measuring the health of the business can thus be summarized in BOM, Utilization, Lifespan, Attrition and Cost structure or one unit.
For some time now I’ve advocated a similar approach for Apple.
The idea is to look at each Apple device sold as a black box that requires investment, generates revenue and, given a certain cost rate, produces a profit. Indeed the company has suggested that this is how it measures itself and has now encouraged us to do the same by withholding measurements that misdirect us away from this method.
Unit sales for Apple are like unit production rate for micromobility. It’s certainly important to know how many e-scooters or e-bikes can be manufactured and deployed but it’s far more important to know how long each one lasts (lifespan) and how frequently it’s used (utilization) and what pricing can be obtained for that use or a per-mile basis.
A restriction on unit production could slow the network’s growth but it may not affect the demand measured in miles of distance that users need to cover. A lack of vehicles means users will hire cars or walk or transit or perhaps won’t take the trip at all. But once supply is provided the choice of micromodes should compel users to use them.
In this view, the Apple business can be seen as a base of devices multiplied by the revenue per device subtracting the cost.
In the latest letter to investors Tim Cook wrote that the total number of active devices has increased by more than 100 million in the last twelve months. Given that the figure a year ago was 1.3 billion, the current total must be 1.4 billion. We can also estimate that Apple sold about 303 million devices in 2018. This implies 2 out of 3 were replacements and 1 out of 3 increased the base.
Services revenues were about $40 billion in 2018 (up 28%). Total revenues were $261.5 billion.
Thus for the whole of 2018:
- $194 per active device of which…
- $30 in service revenues per active device
We can repeat the process for costs and earnings.
Through this lens, Apple’s business over the last three years can be seen in the following graph:
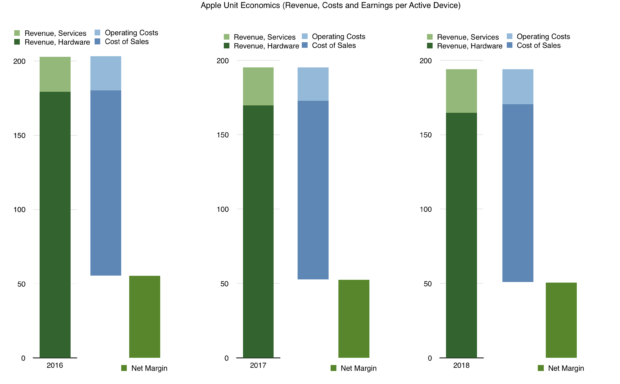
A few observations:
- The business is remarkably stable over the last three years.
- The top line went from $179 to $165.
- The bottom line (Net margin) per device went from $55 to $51.
- This happened while the base multiplier went from 1.15 billion to 1.4 billion.
- Service revenues are increasing (from $24 to nearly $30)
Seen this way the pattern of service growth at the expense of hardware is clearly evident. This is generally contrary to perception when looking at devices sold per quarter.
This is a three year snapshot but if we were to forecast longer term, the questions that arise:
- How rapidly can the base multiplier rise? It had been rising at 150 million/yr for two years and 100 million for one year. What is the likely increase in the future? What is the saturation point? Is it 1.5 billion (which seems a year away) or is it 2 billion or more?
- How are services ramping? The revenue per device is ramping in an accelerated rate (from $2/yr/yr to $3/yr/yr). How high can revenue per device rise? Is $50/yr possible? Higher?
- Is the ASP increase reducing hardware revenues? This point is contentious and I will write about it separately.
It’s going to take a while for this view of the company to prevail but it’s clearly the way the company itself operates and how it sets its objectives.
- If you want to learn about the real future of transportation sooner rather than later, do consider coming to the Micromobility California conference. [↩]