Join me for #AsymcoFridayNight a discussion of the methodology of predicting Covid-19 infection rates and the Apple financial report for Q1 2020.
Here are the links to sign up:
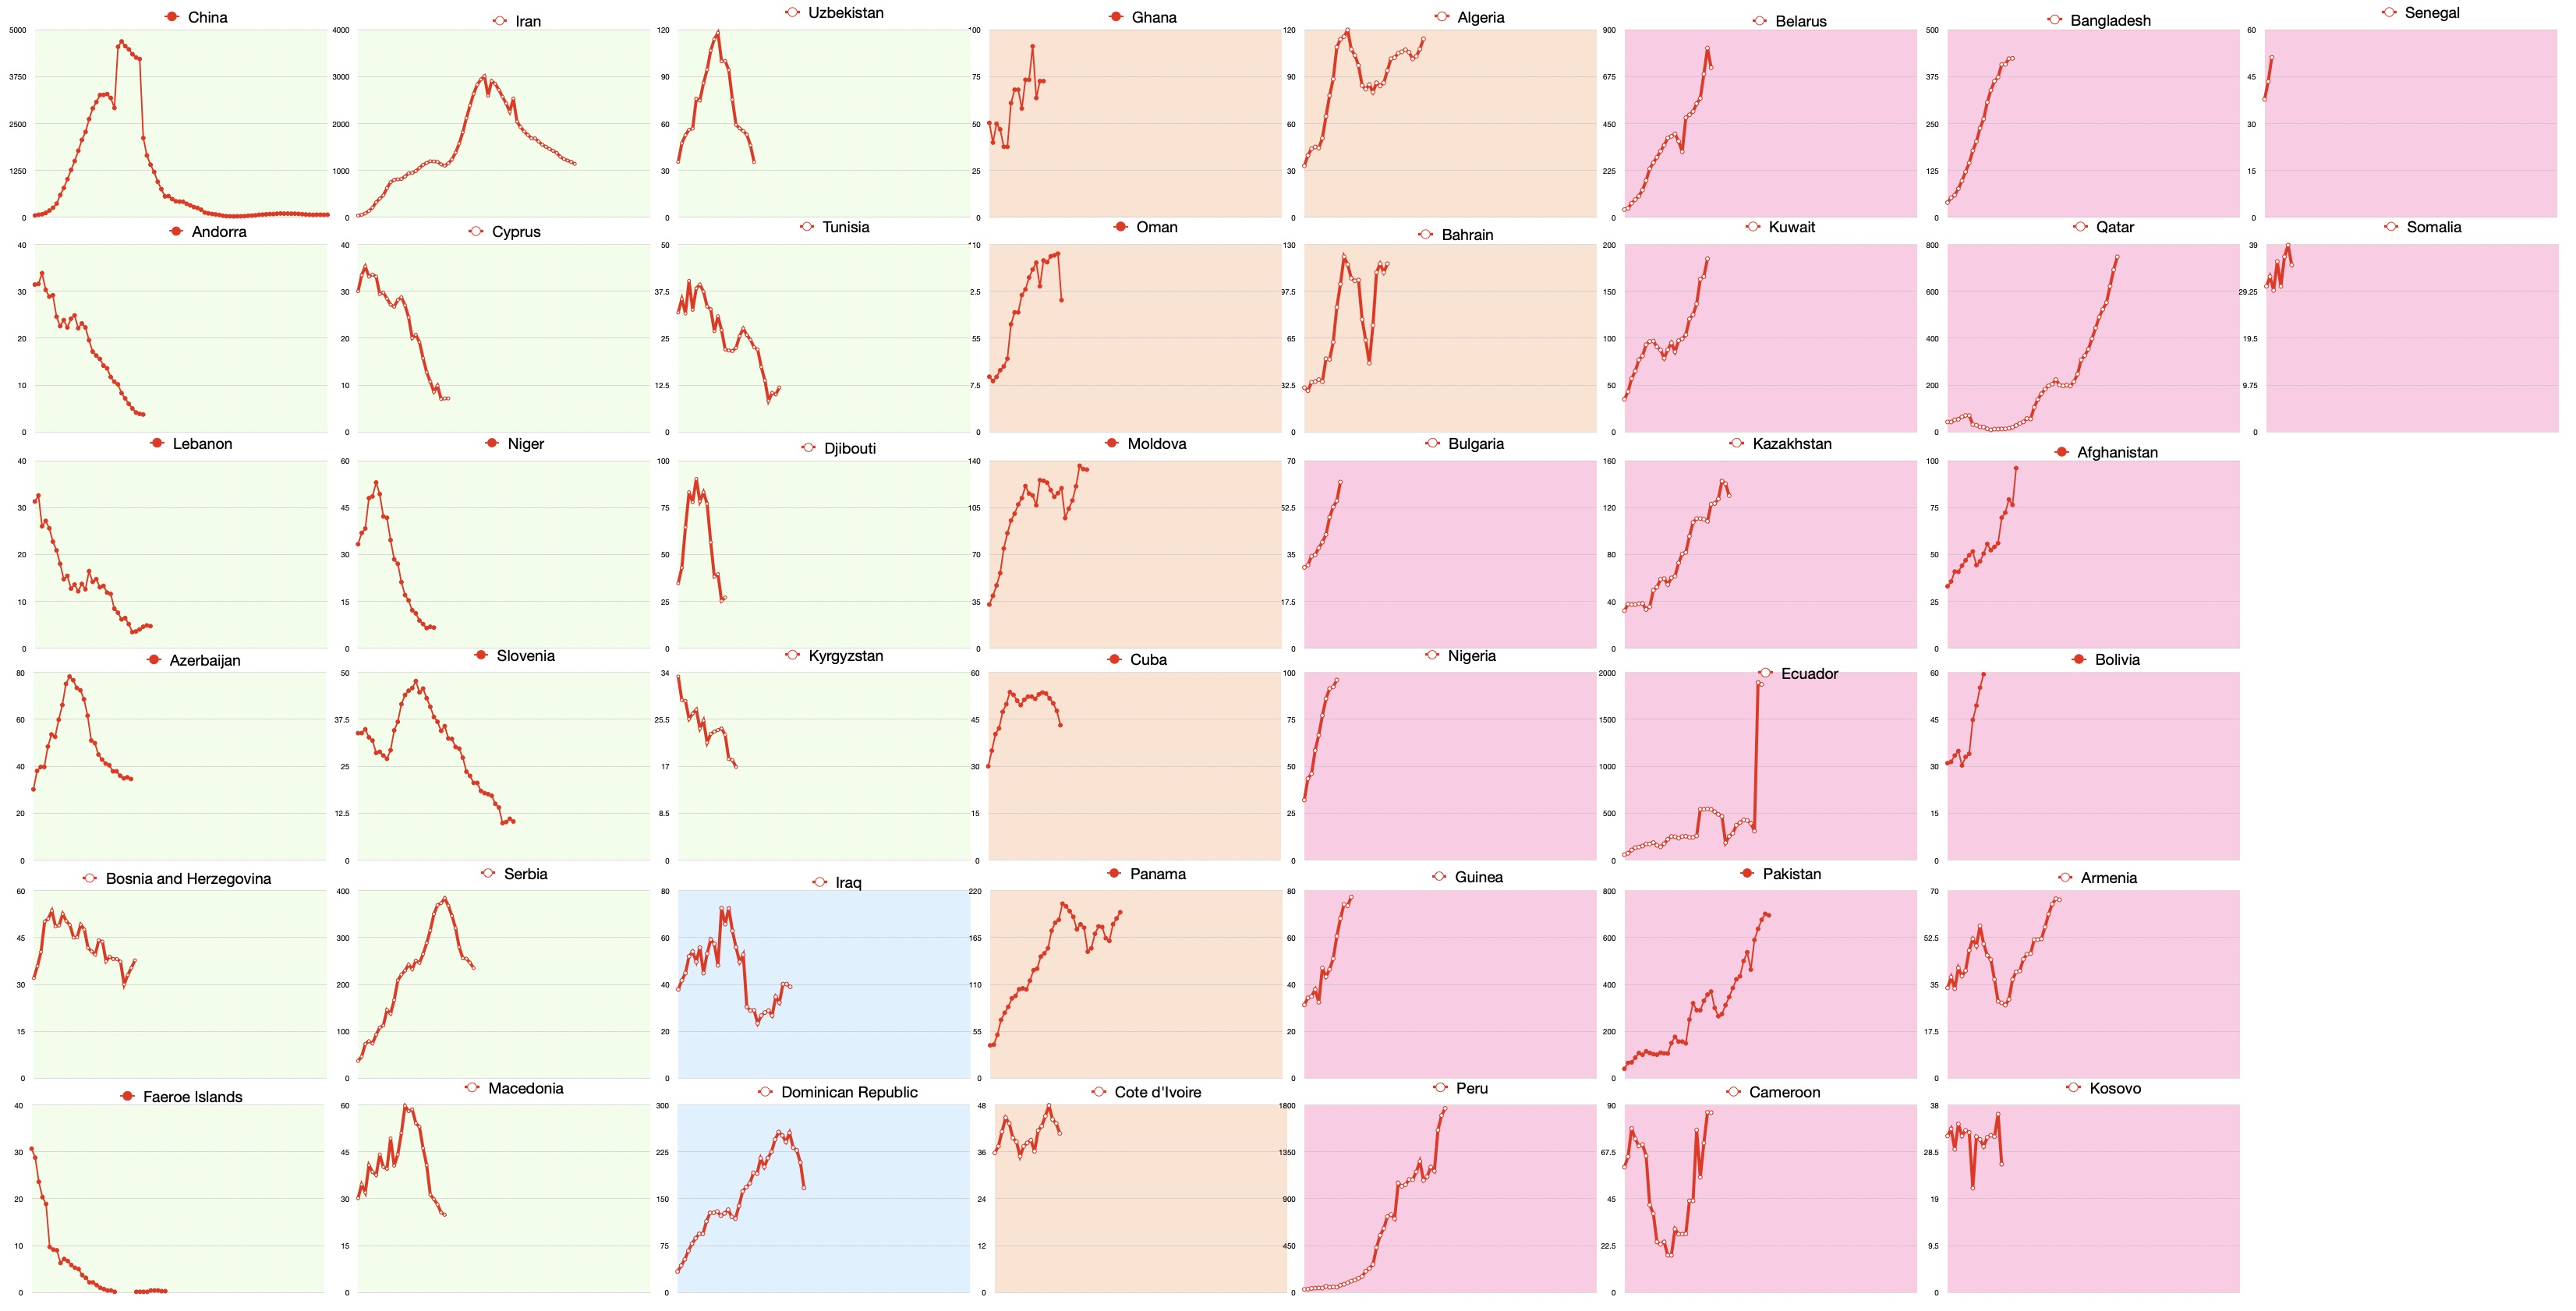
The Covid-19 case rate for 99 selected countries and the EU. Apple Mobility Trend for 55 countries.
Background color coding:
- Green: Late Stage (>50% post-peak)
- Blue: Middle-Late Stage (~50% post-peak)
- Orange: Middle-Early Stage (peaked)
- Pink: Early Stage [or indeterminate] (pre-peak)
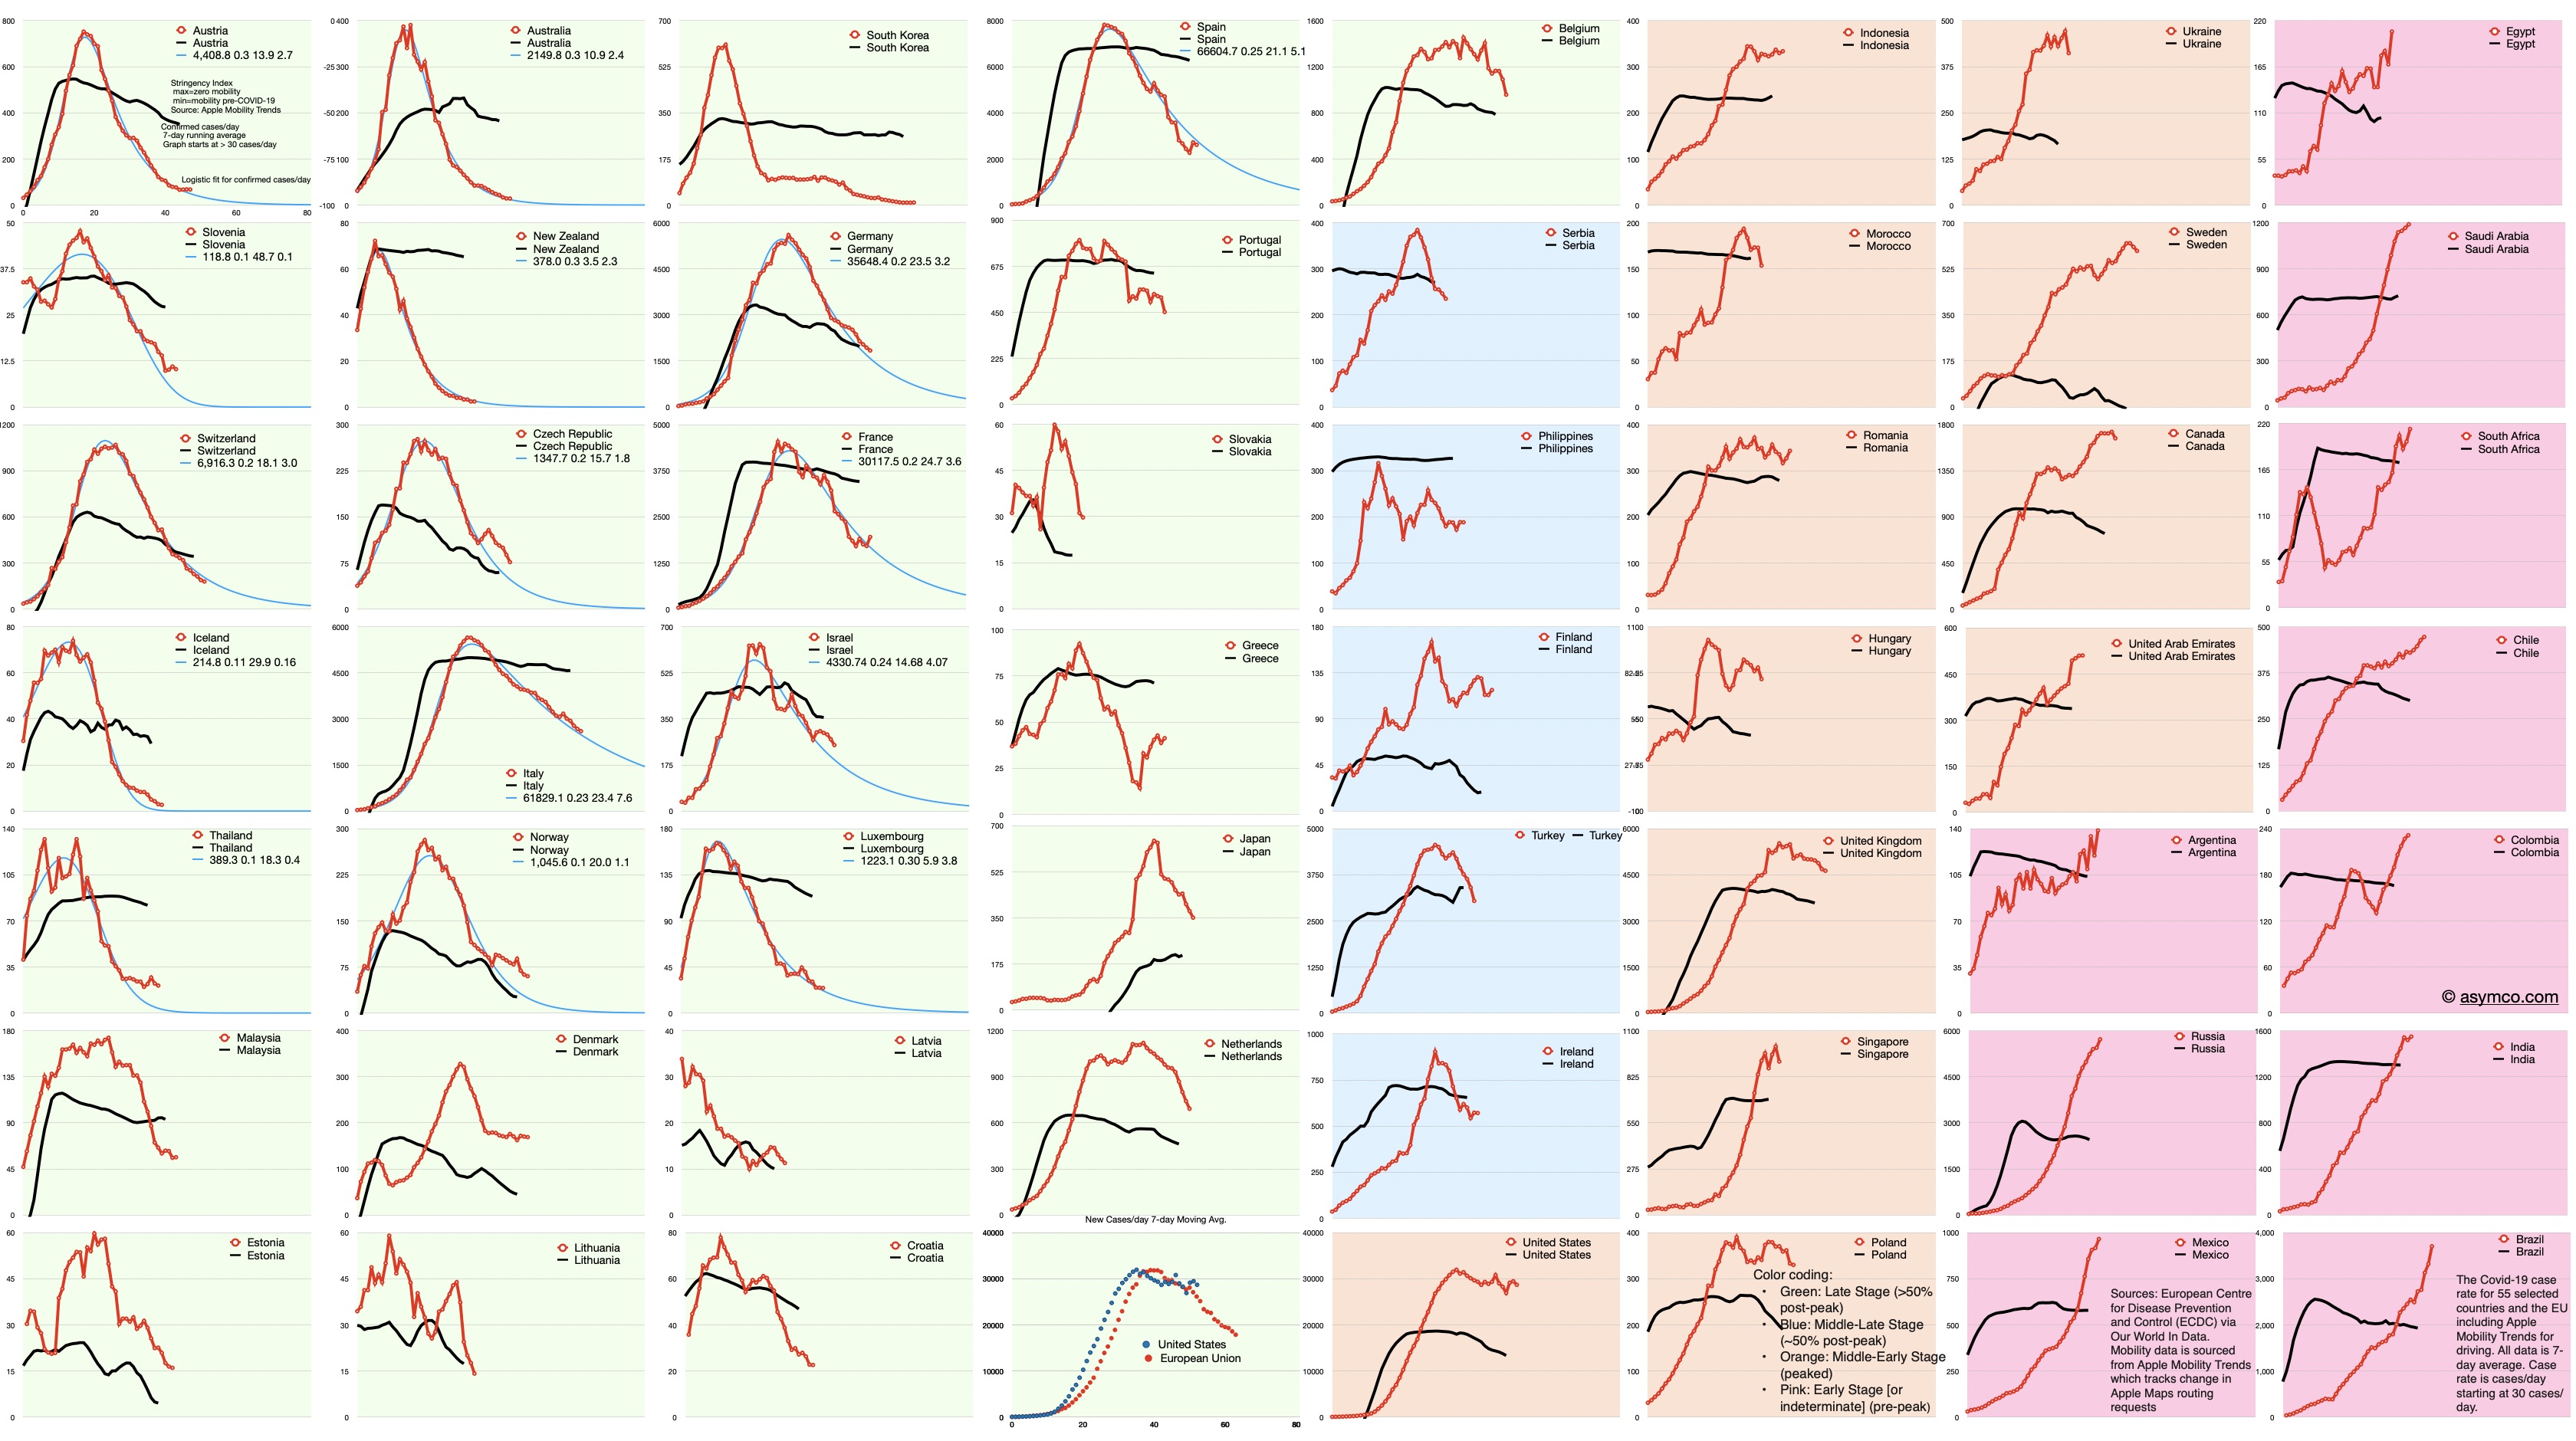
Black line is Stringency Index which is inverse of Apple Mobility Trends (lower bound means no change in mobility, upper bound is zero mobility).
All points are 7-day averages.
Click on images for higher resolution or download.