
Join me for #AsymcoFridayNight a discussion of the methodology of predicting Covid-19 infection rates and the Apple financial report for Q1 2020.
Here are the links to sign up:
The Covid-19 case rates for 49 selected US States or Territories.
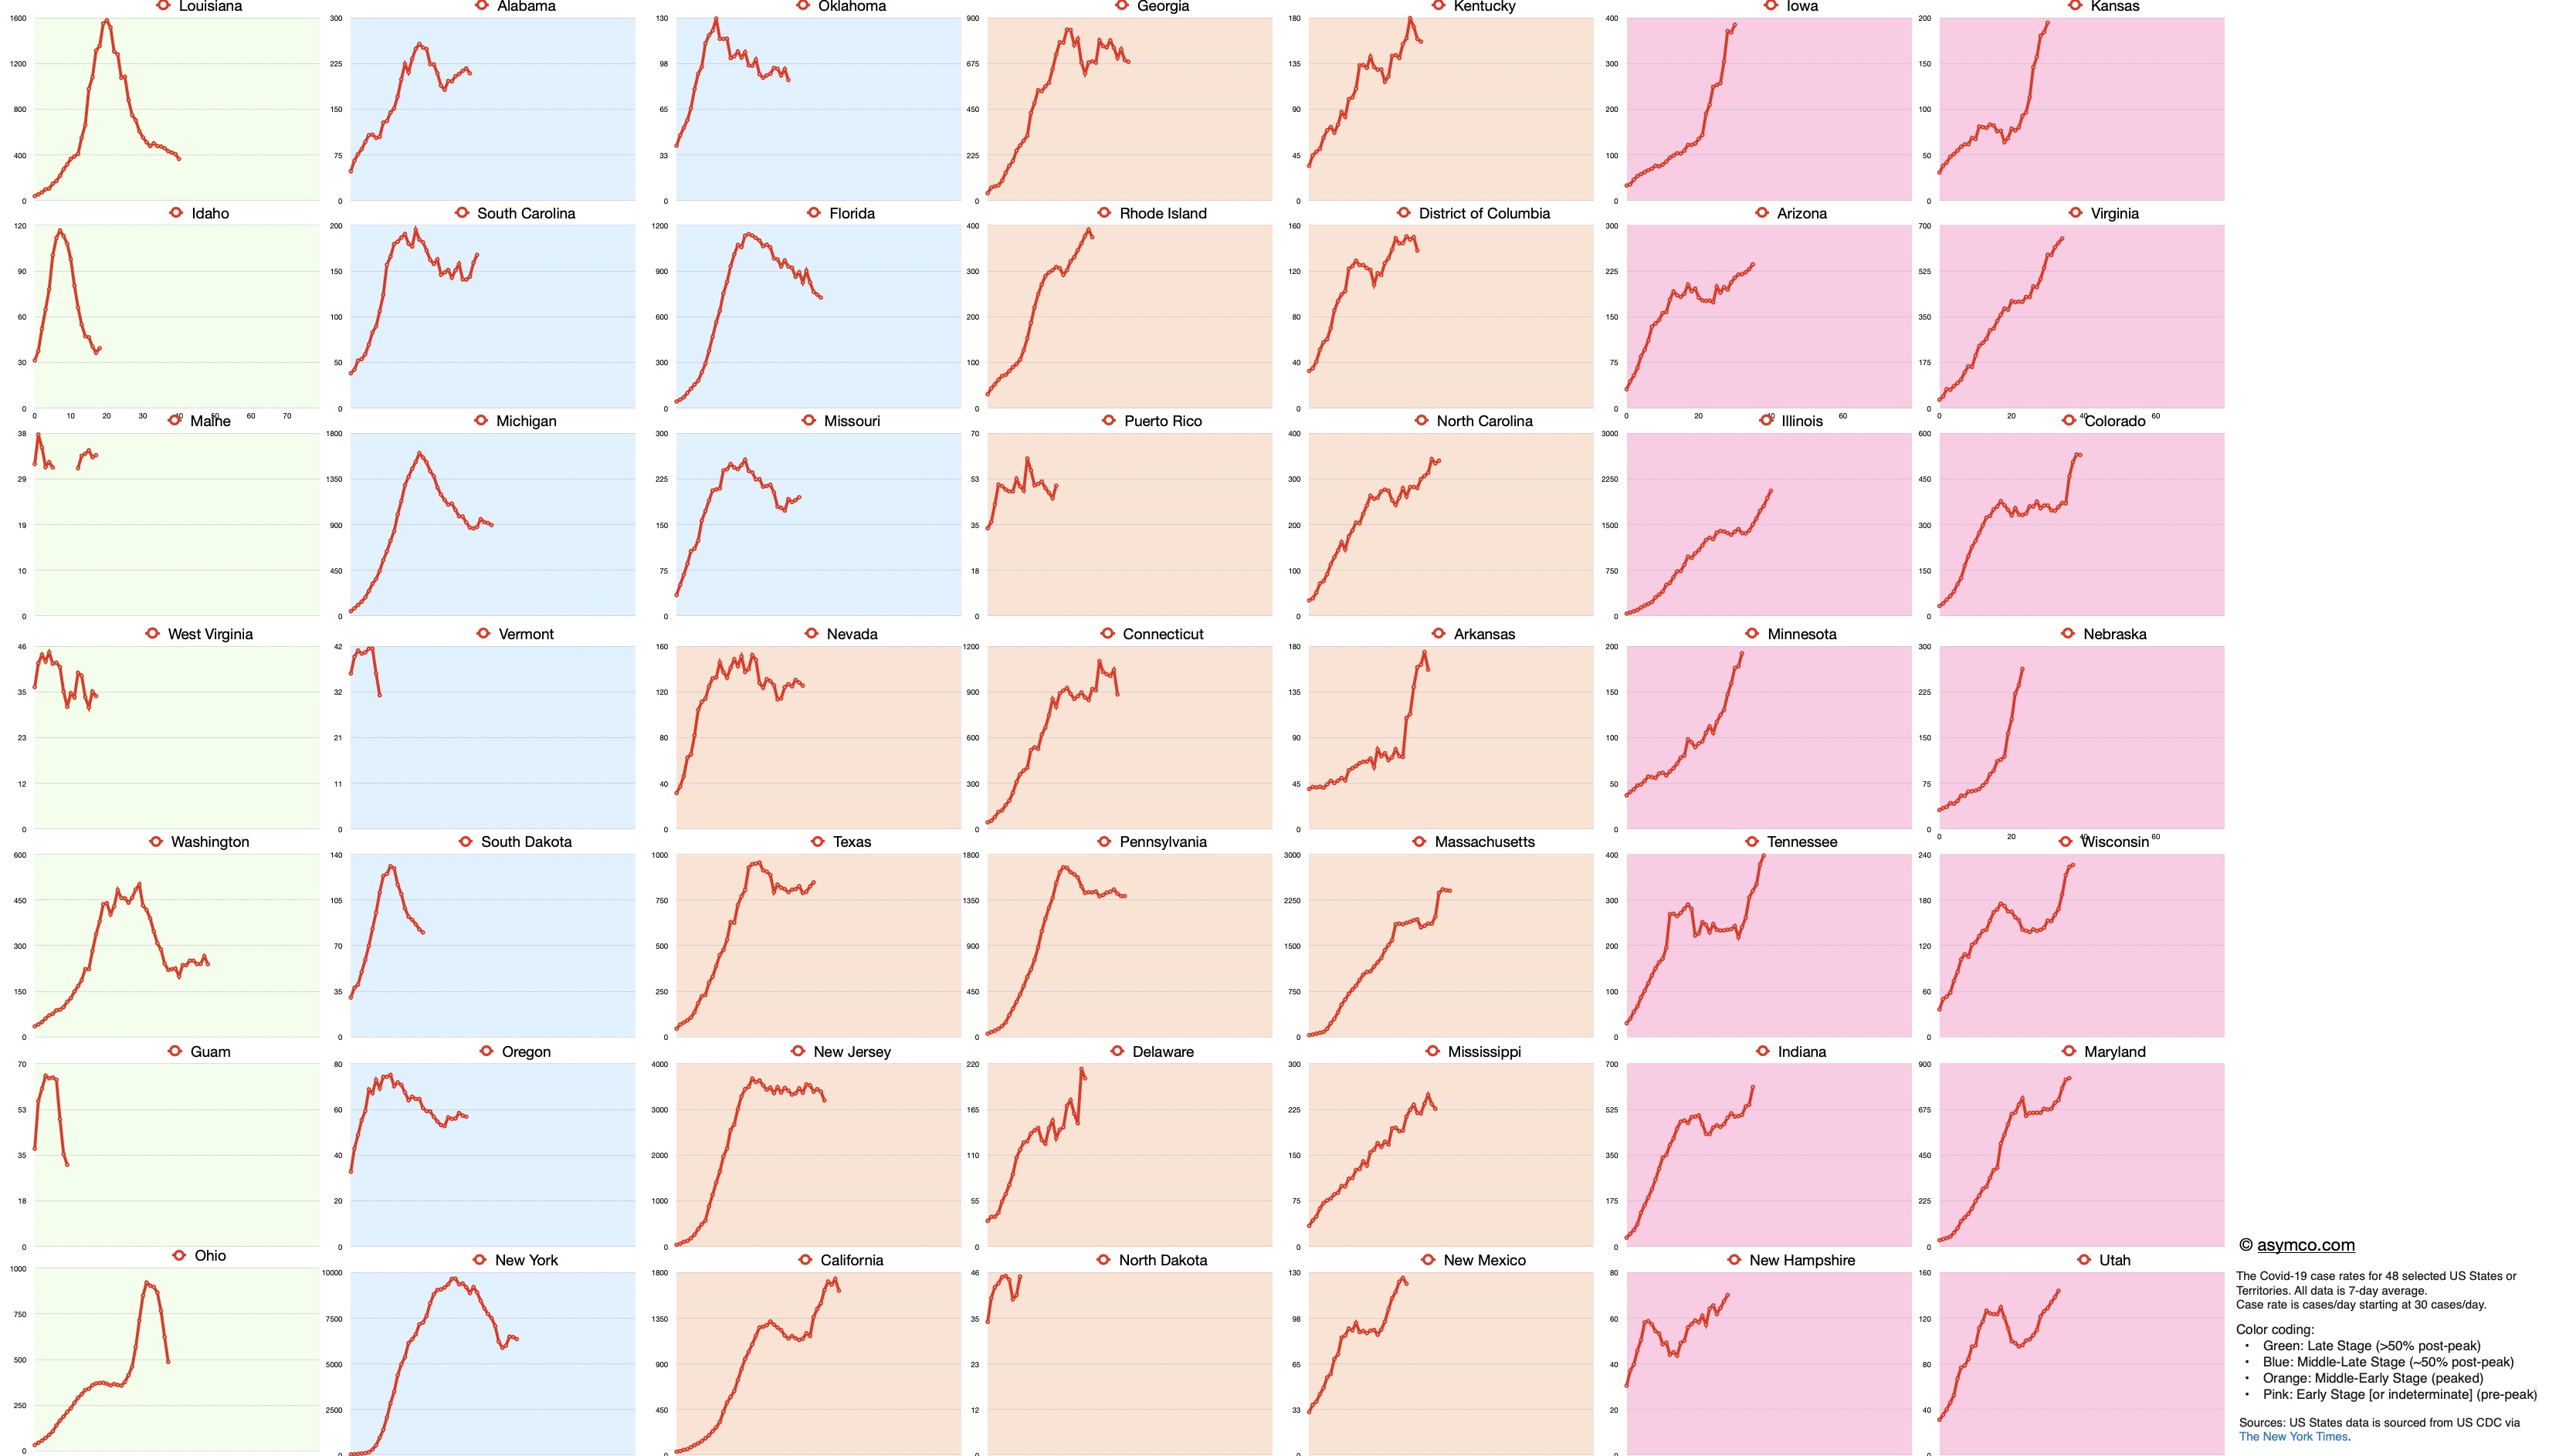
All points are 7-day averages.
Click on image for higher resolution or download.
Color coding:
- Green: Late Stage (>50% post-peak)
- Blue: Middle-Late Stage (~50% post-peak)
- Orange: Middle-Early Stage (peaked)
- Pink: Early Stage [or indeterminate] (pre-peak)
US States data is sourced from The New York Times.