
The data is finally out. Apple Services and perhaps Apple itself can be quantified and predicted as never before. As we shall see this data changes almost everything we know.
It is even more shocking that this most important data set has been released by Apple itself. (Though it did so in order to comply with regulation, Apple did offer a bit more detail than was required.)
I am speaking of course of the European DSA Recipients of Services Report publication for the European Digital Services Act. Available in all the languages of the European Union, and thanks to Ireland and Malta, we can even read it in English.
What the data shows is the number of average monthly active recipients in the EU of Apple-provided data services, calculated as an average over the period of the six months to 31 July 2023. This number is 123 million.
In addition, if you follow the link, you can see the number of recipients broken down by Member States. I summarize this data below.
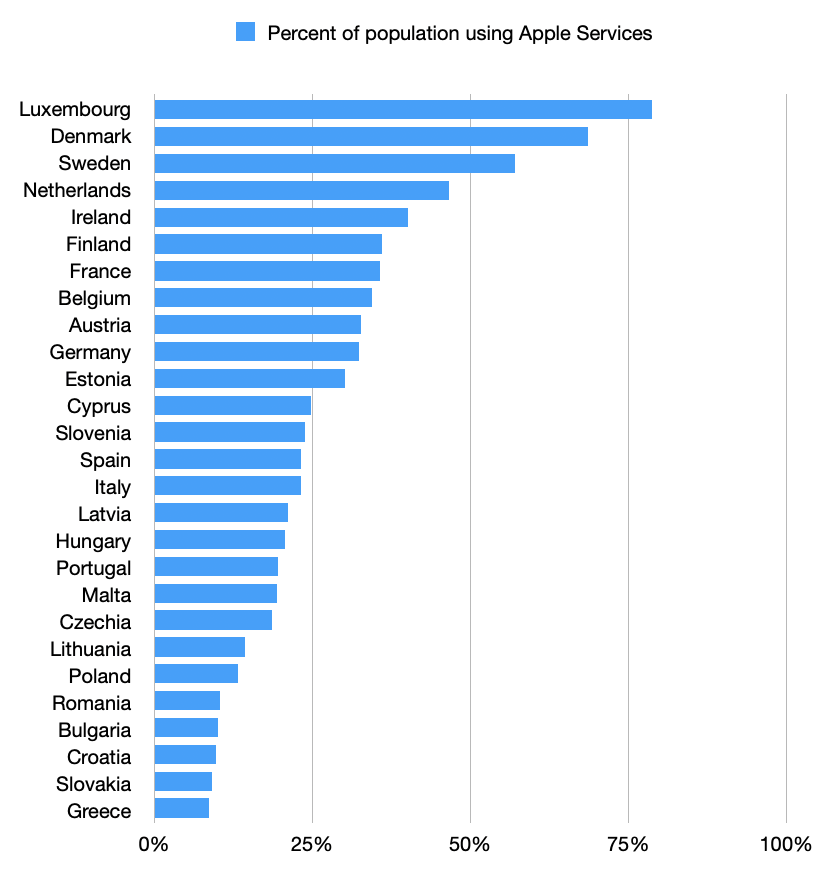
Note that my summary is not that of the absolute numbers of recipients but the percent of population that these numbers represent. Note further that for some of the states with less than 1 million total recipients, estimates had to be generated. These were done in order to complete a total of 123 million. You’ll have to trust me that these estimates make sense.
This release of data might be amusing for the ranking we obtain, showing which countries’ citizens are more likely Apple fans than others. Seeing, for example, that the nordic countries show more affinity for Apple than the balkans; whatever that implies.
But a geographic categorization is banal. What would be more interesting is to look for a proxy for Apple adoption that is predictive. I know what you’re thinking: it’s obvious, look at income. More precisely GDP per capita. The data yields the following.
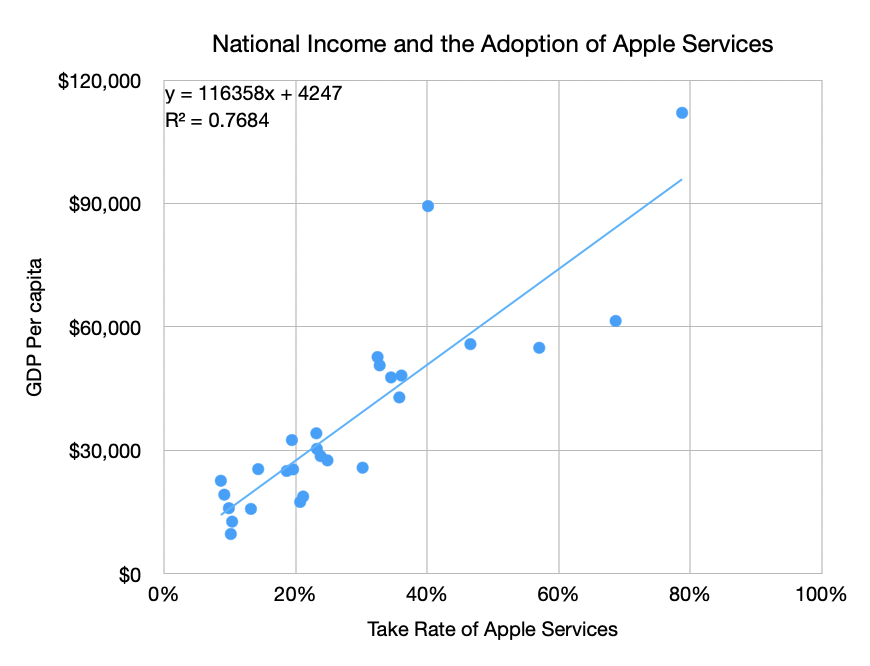
Please keep in mind that some countries might have missing or outdated data, and the values presented here are based on information available up to 2021. Note that there is one outlier. That data point around $90,000 and 40% adoption is Ireland. It’s an outlier because the GDP income for Ireland includes the large number of multinational firms based there. That includes Apple, Facebook, Google and LinkedIn, etc. which pull GDP above what would be assumed by GNP.
With Ireland the data fits with the coefficient r-squared of 0.77. Without Ireland it’s 0.85. This seems good enough to me to estimate the relationship of Apple Adoption ~= (National Income – 4247)/116,358. The trend line in the graph above shows this relationship.
What are the implications?
First, the ends of the line need to be finessed. 100% Apple Adoption is suggested at income of $116,358/yr/capita. Also, 0% Apple Adoption happens below an income of $4,247/yr/capita. Now both of these are problematic as there are known adopters in countries with income below $4,247/yr (more about this later) and there are countries with income above $116,358 which cannot therefore have more than 100% adoption (or can they? This makes a good trivia question.)
These anomalies should encourage us to look further. What if we apply this formula for countries outside the EU? To answer this, I generated a country set with about 190 entries and applied the pattern seen within the EU country set (n = 27.)
Knowing the GDP per capita for all countries as well as population size, we can estimate the global total of Apple services subscribers to be 560 million individuals. Note that Apple reports 1,010 million total subscriptions but that includes multiple subscriptions per subscriber and subscriptions to services which for Apple only acts as guarantor through the Apple App Store. Overall data on Apple Subscriptions (and other details) is provided below:
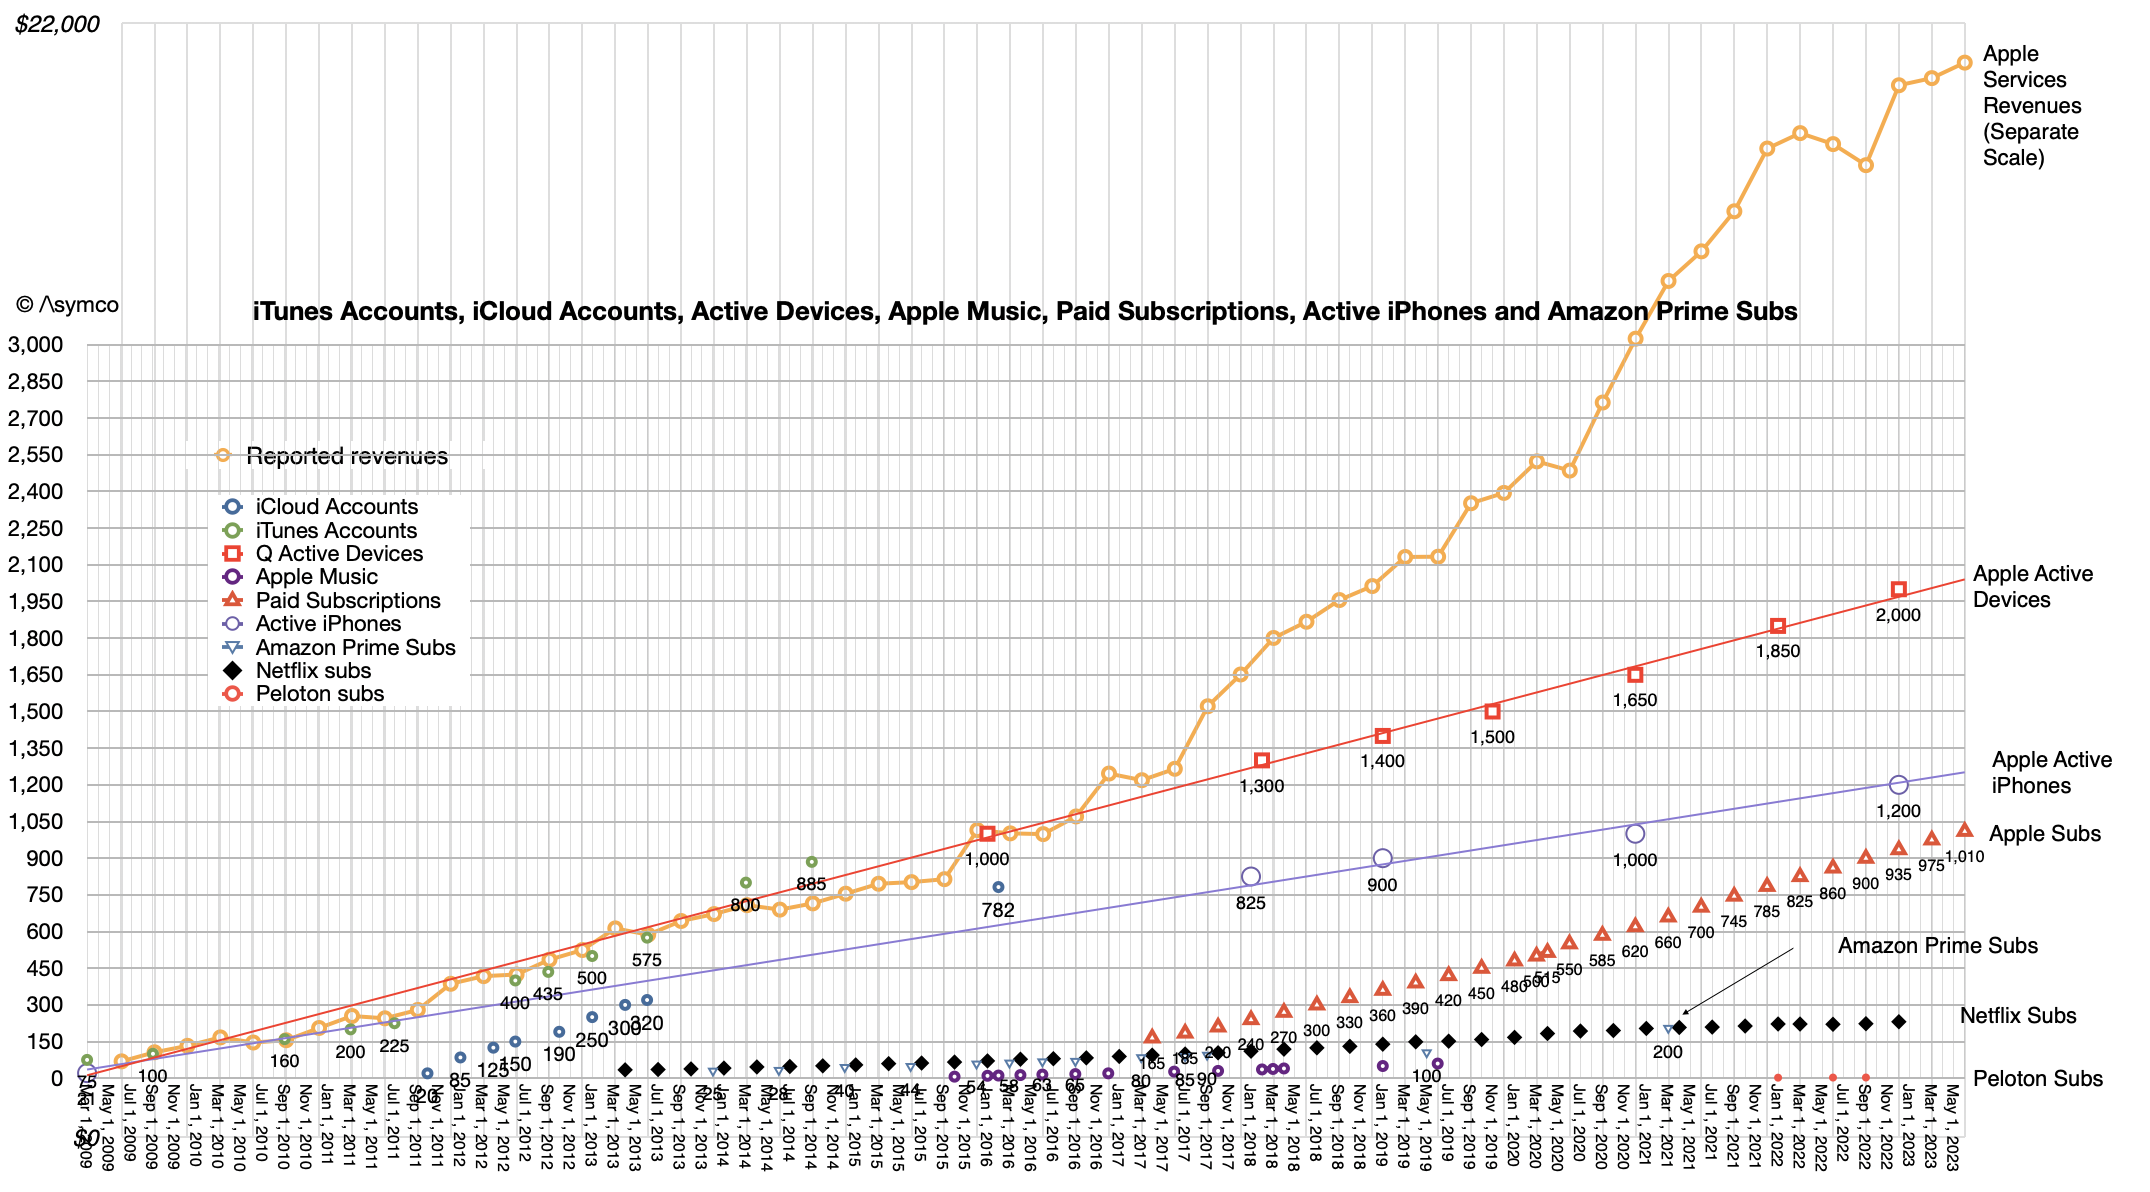
Note that we know the total active devices to be over 2 billion and the active iPhones to be about 1.2 billion. This implies that about half of iPhone users have an Apple-owned subscription and that over half of the subscriptions Apple manages are for its own services.
What’s more, we can obtain a detailed list of expected Apple Services users for each country. An example would be 5.8 million users in Mexico or 1.7 million in New Zealand. [I could furnish this on a country-level in a newsletter, if anybody is interested please let me know.]
It also allows us to understand the potential for countries which currently are below the model’s threshold of income. That list consists of 88 countries with a combined population of over 4 billion. They will join the Apple ecosystem, it’s only a matter of time. Can we predict this? I believe so. Stay tuned.
The story of Apple Services is only getting more important but also more detailed in terms of data and analysis. Readers of this blog have been well prepared for what happened and Apple has followed through with gross margin data and now with some limited country-level data.
As we move into the era of spatial computing, services will only matter more and it’s imperative that observers of the company stay on top of the data with solid modeling.