
As I remember it, at least 10 years ago, I began to hear anecdotes from developers who built apps for both iOS and Android about their economics. The story is that they tended to have twice as many users using Android but that iPhone App Store revenues were roughly twice those of Google Play Store. From that I devised a rule of thumb that an iPhone user was about 4 times more valuable than an Android user. Half the users, paying 4 times as much means double the income.
Over the years I came across a lot more data about market development (the diffusion of innovations) and market creation (the innovation process) and applied it to transportation. Along the way I also became more aware that figures of consumption and spending are not normally distributed. That it turns out that the governing function of much of human behavior is log-normal. That is, it is skewed rather than balanced or symmetric around an average. Classic examples are income distribution and the distribution of travel distances.
Consider the following diagrams: Trip Distances vs. Trip Speeds for New York Citi Bike travelers (n=42.7 million.)
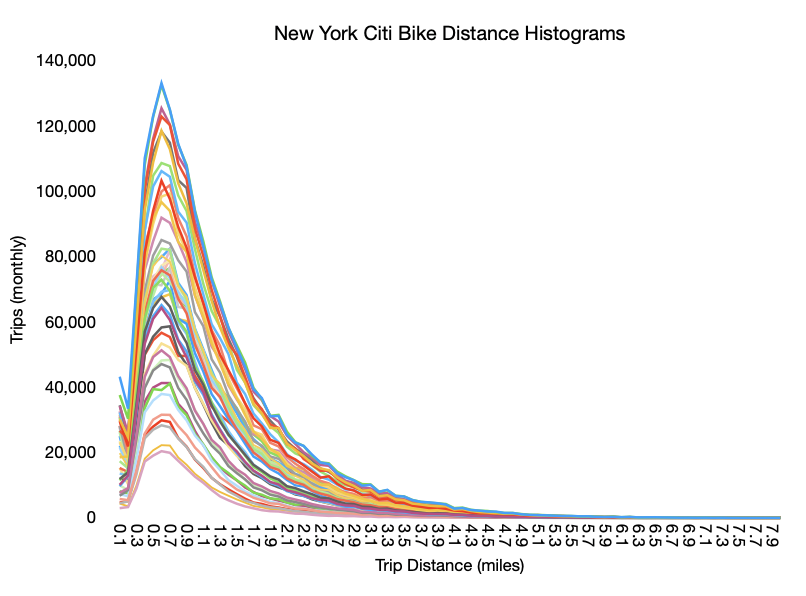
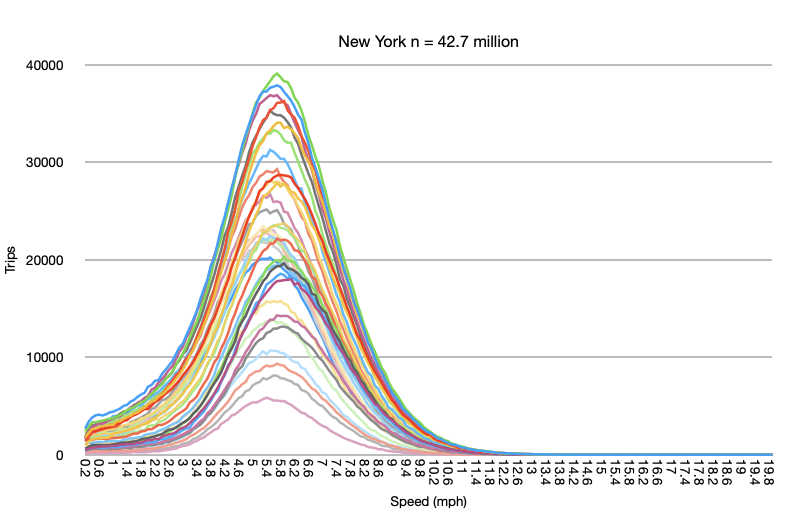
The different lines represent different time periods spanning the months of the year.
The top graph shows that most trips are short, and the average distance is not the most common distance. The bottom graph shows that the average speed is the most common speed. The top graph is very accurately modeled with the log-normal function. The bottom graph is the classic bell curve of the normal or Gaussian function.
Income is log-normally distributed and so it has to be with services revenues. There must be a definite skew where there is a disproportionate spend by those who have more income. Thus segmenting or, to put it less kindly, discriminating customers properly is super important. Customer quality is just as important, perhaps more so, than quantity.
So let’s revisit the question of user quality for online services.
Unlike 10 years ago, there is a lot more data. The EU, for instance requires a report of the number of users on each platform.
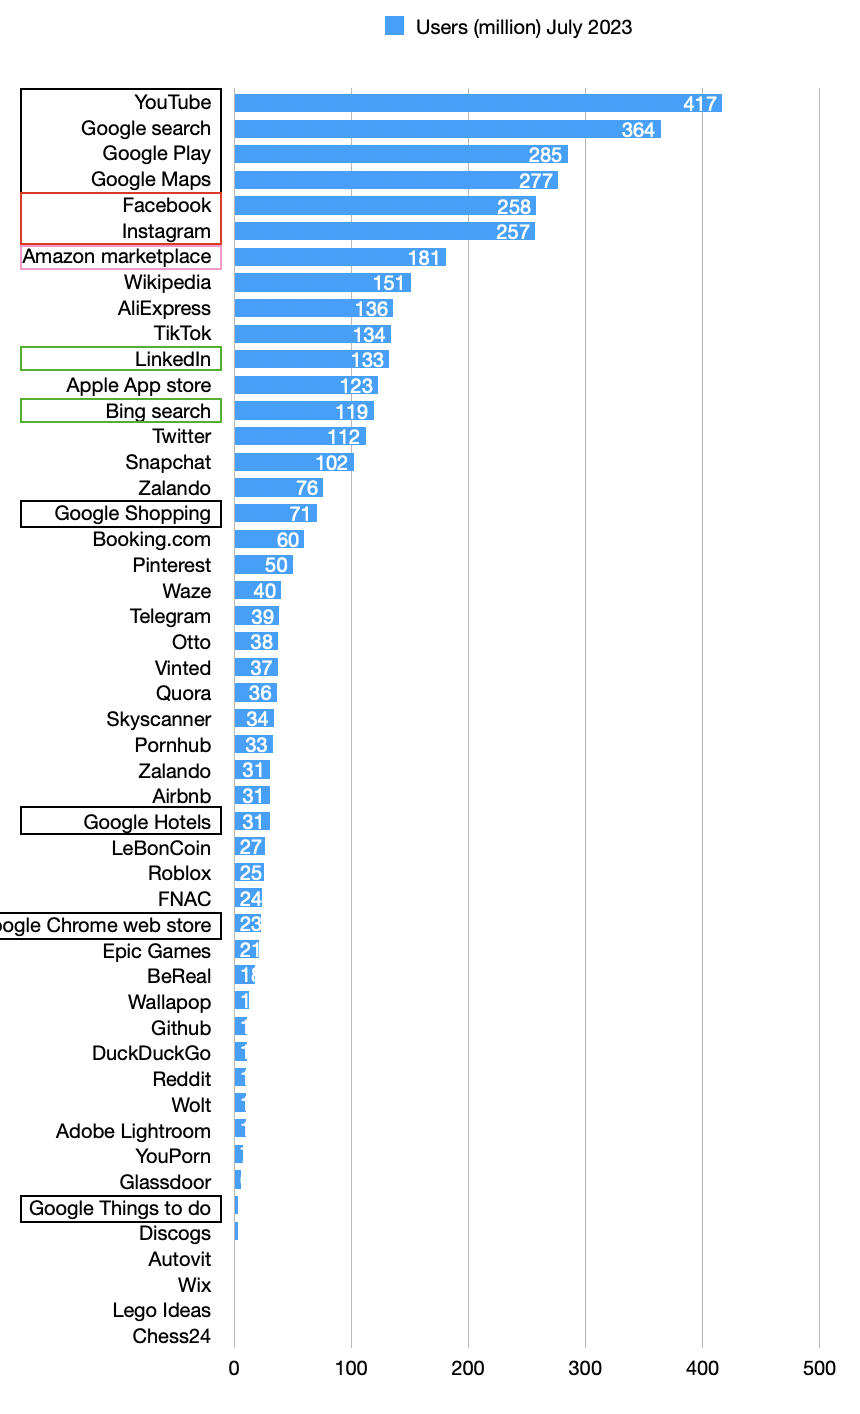
The figures I want to focus on are those of Apple App Store and Google Play Store: 123 million and 284.6 million respectively. These are strikingly similar to the ratio of 2x between iOS and Android from my old anecdotes. However, if we look at global data, Apple claims 650 million active App Store users while Google claims 2.5 billion active users. That makes the global ratio closer to 4x Android. However, if we look at the US, the ratio is 167 million iPhone users vs. 144 million Android. In the US, iOS is a majority.
This is explained by income. The wealthier the user base the more iOS seems to be in use.
Now let’s look at revenues for the platform stores.
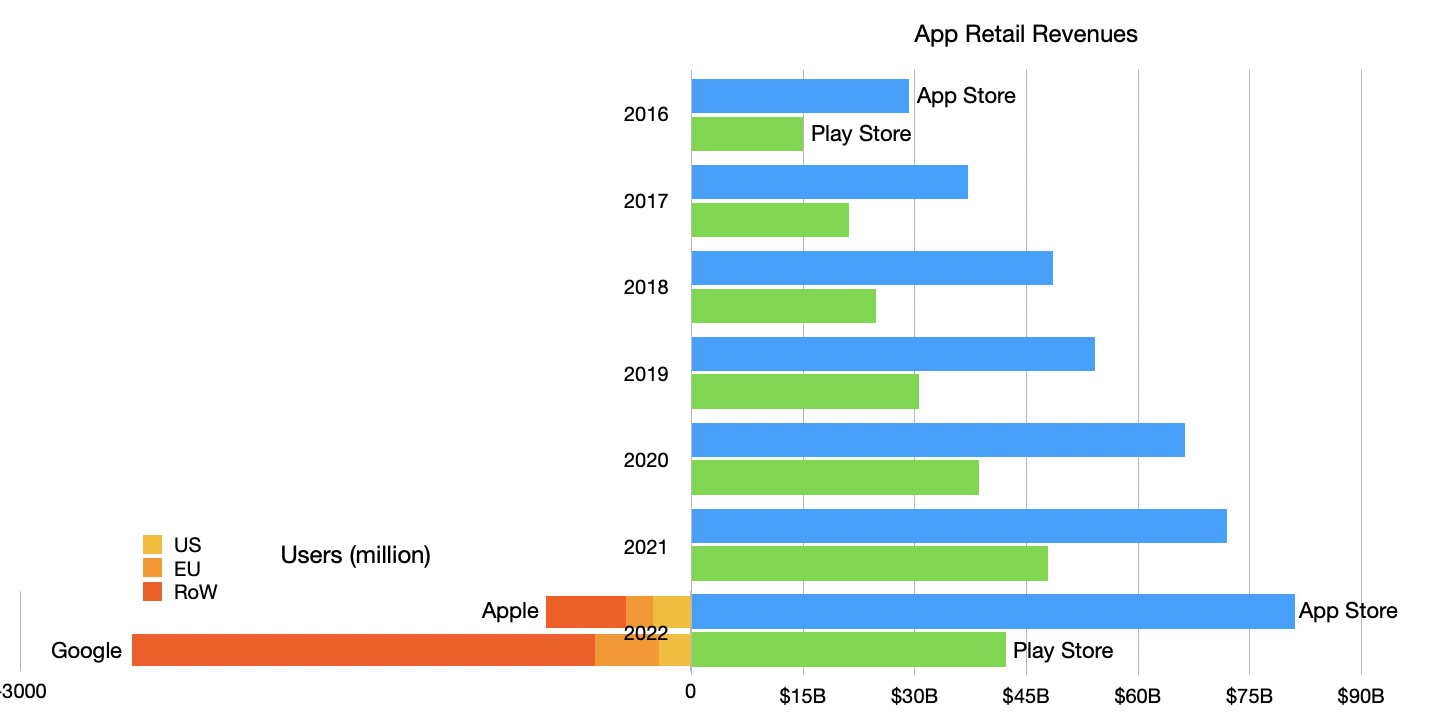
On the right side is the history of retail revenues by year from 2016 to 2022 and split between Apple App Store and Google Play Store. Mirrored on the left is the number of users, also split by store but also by region, but only for 2022. [App Store revenues are my own analysis (with validation against other sources) and include billings not just Apple’s own cut. Play Store revenues are from Business of Apps.]
The ratio between revenues has kept remarkably steady, with 2016 revenues at a Apple:Google ratio of 29:15 (1.93) and 2022 at a ratio of 81:42 (1.93).
The global user numbers are, as mentioned, 3.8 to 1.
[Aside: One sanity check on the data is that the 650 million App Store users is about half of my estimate of iPhones in use (1.2 billion). That might be alarming. Why are only 54% of iPhones in use paired with App Store use? However, if we take the sum of both App Store and Play store users (3.15 billion) and compare it with the total number of global smartphone users (6.92 billion), we discover that 45.5% of all smartphone users use some store. Adding Chinese Android stores we can see that the ratio of 54% for iOS is somewhat consistent.]
Thus we can compare the app revenue per user of the two platforms by dividing global revenue number by the global user numbers. The results are shown below:
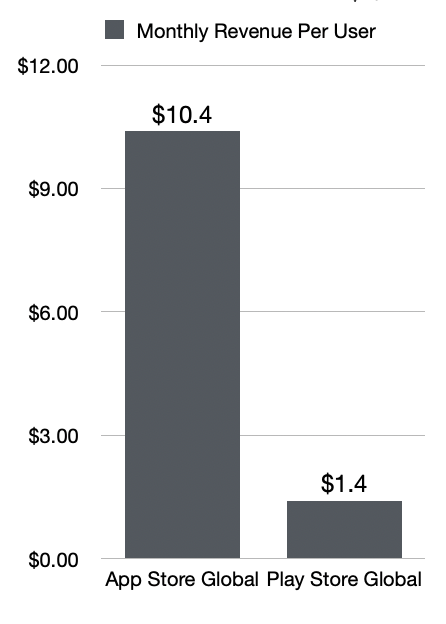
I scaled the spending to a per-month basis.
So the picture becomes clearer. The iPhone customer is 7.4 times more valuable than the Android customer. This is more impressive than the 4x rule I had 10 years ago. The reasons are mainly that my anecdotes were from developers who sold products in the US or EU whereas expansion of smartphones to 7 billion global users has drawn in more lower spending customers.
But Apple’s base has also grown to over 1 billion users (650 million store users). This highlights that Apple has effectively grown and discriminated customers effectively. It obtained not just 1 billion customers but the best 1 billion customers.
How to discriminate effectively is the holy grail of marketing. The naïve approach is to keep prices high. But that usually only results in a “luxury” branding and a small base that tends not to grow. The alternative “premium” approach is to offer functionality and multiple tiers and distribution options and financing and merchandising. There is no simple formula.
The bottom line is that Apple’s approach is attracting 650 million $10/month app spenders. When we factor in additional subscription services, we get to the juggernaut that is Apple Services. This analysis has shown how difficult it is for anyone to come close to this quality of revenue.
As we look forward to Spatial Computing, the idea of increasing that spend from $10/month for a small glass rectangle in your palm to perhaps $100/month for an immersive 360-degree 3D experience does not sound too crazy.
But only if you can find those customers. I suspect Apple already knows who they are.
If you want to learn more and hear an in-depth discussion on this topic make sure you subscribe to the Asymetric Podcast on Supercast and Apple Podcasts.