For more analysis of Apple & the industry, join us at ACTIVE 2025.

Beleaguered

Amazon’s recent disputes with publishers (Hachette and Disney) shows a degree of market power that is closer to monopsony than to monopoly but this power is nevertheless real. It may not not be something that requires intervention, regulation or even scrutiny but market power is evident in both how companies operate and in how they are valued.

If you look at the following graph, it’s easy to spot those with “monopoly” power. The graph shows a short history of revenues/operating income and P/E ratios. Modest or no growth in earnings coupled with extraordinary high P/E ratios indicate that the market understands the business is not threatened by competition.

Screen Shot 2014-08-14 at 8-14-1.40.47 PM

Continue reading “Beleaguered”

A Dollar a Day

There are 80 million Mac users. The last 12 months saw sales of 18 million Macs.

As of the end of June there were 886,580,000 iOS devices sold. As of today the total is well over 900 million. One billion sold will happen well before this year is out. Estimates of current iOS users vary but they are probably at least 500 million and could be 600 million.

Screen Shot 2014-07-25 at 7-25-2.44.06 PM

Apple claims 800 million iTunes accounts.

Therefore, in terms of revenues:

  • Mac User = $289/yr
  • iOS User = $262/yr
  • iTunes User = $25/yr1

Adding iTunes usage to either Mac or iOS yields Continue reading “A Dollar a Day”

  1. Measured from billings []

Is the PC back?

Gartner’s own press release has an interesting spin:

“After Two Years of Decline, Worldwide PC Shipments Experienced Flat Growth in Second Quarter of 2014, According to Gartner”

Gartner’s actual figure is 0.1% growth. Gartner and IDC measure slightly different quantities as “PC” but they don’t disagree much. IDC still shows declining PC sales at about -1.7%. However both also include the Mac in their accounting of PC. If we were to remove the Mac and measure “Windows PC”1 Gartner’s figures would show -0.8% drop in PC ex-Mac shipments.

The difference in growth between the Mac and non-Mac PCs is shown in the following graph.

Screen Shot 2014-07-23 at 7-23-5.23.08 PM

As Apple puts it, the Mac grew faster (and hence gained share) for 31 out of the last 32 quarters.  It missed on this perfect record during the fourth quarter of 2012 when the then fresh new iMac was impossible to buy due to production issues.

So as far as the Mac is concerned the slowing of the decline in PC unit shipments isn’t at its expense. Continue reading “Is the PC back?”

  1. In quotes because this total includes Linux and Chromebook []

Airshow is coming to Tokyo

I will be conducting our 10th Airshow event in Tokyo on Thursday, 17 July 2014.

Airshow

The purpose of Airshow is to:

  • Understand how data can be used to persuade through an appeal to logic as well as through empathy.
  • Understand the basics of “data cinematicism” including the techniques analogous to cinematography and direction.
  • Understand story development techniques including how to facilitate the audience’s entry into the story.
  • Learn how to build a cinematic presentation.

The method we devised borrows heavily from the techniques of cinematography and screenwriting to impart meaning to the audience beyond the literal words spoken or images shown on screen. These techniques are demonstrated with “feature presentations” and then deconstructed in interactive lectures. Throughout we also weave Aristotelian rhetorical tips and present from the Asymco repertoire of stories.

See Airshow Tokyo event page for more information. Registrations are available. Students may register for academic discounts.

The Critical Path #118: The Cook Doctrine

We reflect on why the narrative on Apple has changed post-WWDC and analyze both the evolution and consistency of Apple’s culture. Furthermore, what elements of that culture/process/priority setting can be copied? In other words, what does it take to be great?

via 5by5 | The Critical Path #118: The Cook Doctrine.

Late late majority

Seven years after the iPhone was launched, 70% of the US population is using smartphones. Smartphones existed before the iPhone so the category is older than seven years but as far as adoption goes this is nearly the fastest ever.

The CD Player reached 55% in seven years and the Boom Box about 62%. If measuring the period between 9% penetration and 90%1 the smartphone in the US will have a lifespan of about 9 years starting in 2008. Before this period, the product was largely experimental and participating vendors2 mostly failed. After this period most products will be “commoditized” with decreasing margins and increasing consolidation.

The rapidity of growth is all the more remarkable given the penetration is at the individual, not household level. The total user base is therefore over 270 million rather than the 115 million usually targeted by consumer technology, nearly 60% more purchases. This is also remarkable because the product has a shorter lifespan of use (two years) than is typical for other consumer technology products3

We are therefore now in the “Late Majority” phase of the US market. This is not a surprise. The inflection point in the market occurred in mid 2012 so we’ve been in this phase for two years already. It’s not therefore controversial to predict two years of continuing though decelerating growth.

Screen Shot 2014-07-08 at 7-8-2.39.27 PM

As Geoffrey Moore explained, the marketing of technology products needs to be varied as we get into different phases of the market. Innovators (first 2.5%) need to be sold on the premise of novelty itself. Early adopters (next 13.5%) seek status and exclusivity. Early majority (34%) seek acceptance and Late Majority (34%) seek pragmatic productivity. Laggards (last 16%) seek safety.

One aspect of this adoption cycle that is misunderstood is the role of pricing. The assumption is that pricing matters more as adoption increases. This is misunderstood because pricing always matters and therefore it never matters. Pricing is one of many elements of marketing mix and at any time there are product choices across a wide spectrum of pricing. Pricing is also a signal which can be elaborately obfuscated through bundling and unbundling.

One way to illustrate this is to consider how Apple products behave in the late phases of markets. Apple products have notoriously firm pricing.

Screen Shot 2014-07-08 at 7-8-2.38.26 PM

The revenue per unit of Macs, iPods, iPhones and iPads remains stubbornly consistent. This is not to say that each unit sold is the same price. The company tweaks “the mix” of mid, low and high products to keep the average selling price constant. But fundamentally the average remains constant which means that regardless of market phase, Apple retains its margins.

So as we look forward to the last two years of growth for smartphones, how will Apple fare? Continue reading “Late late majority”

  1. which I consider the “economically attractive” period of growth []
  2. Palm, BlackBerry, Nokia []
  3. e.g. TVs, Refrigerators, Radios, etc. []

Competing effectively against your most potent competitor

New market disruptions take root in non-consuming contexts. For instance, mobile phone photography began not because early phone cameras were good. They weren’t good at all but good enough when a camera was not within reach. The quality was poor but the photo taken would not have otherwise been taken, making a lousy photo better than no photo.

The result is that the total number of photos taken this year will be ten times higher than the total number of photos taken before the advent of mobile phone cameras.1

This rush to use the phone as a camera has meant that phone makers are keen to improve their product (so as to compete effectively with it against each other) and as a consequence they overtake the incumbent camera makers in quality as well as quantity.

The same phenomenon was experienced by fixed component “Hi-Fi” audio products. The quality of mobile music was poor but it was convenient and convenience translated into consumption and consumption translated into quality improvement and eventually the evaporation of usage of the traditional category.

Now consider how ad dollars are getting spent. The following chart shows the eMarketer forecast for ad spending mix across different media in the US.

Screen Shot 2014-07-02 at 7-2-8.12.01 PM

It would appear that the “Mobile” media is competing effectively against the other media types, especially the non-Mobile digital (i.e. PC-based experiences).

However, if we look at the absolute spending forecast the picture shows that Mobile is responsible for most of the growth in the overall spending. Continue reading “Competing effectively against your most potent competitor”

  1. The total number of photos taken in 2014 is likely to be around 880 billion. Prior to 2000 the total number of photos ever taken is estimated at 85 billion. []

The Critical Path #117: Why Did Apple Buy Beats?

Horace talks about CapEx and begins unpacking the massive topic that is The Capitalists Dilemma. We focus on the surprisingly under-discussed data with regard to Apple’s acquisition of Beats. The deal was officially announced within hours of this recording.

via 5by5 | The Critical Path #117: Why Did Apple Buy Beats?.

Questions for Eddy Cue and Craig Federighi

The Re/Code conference begins this week, and Apple executives Eddy Cue and Craig Federighi will be answering questions from Kara Swisher and Walt Mossberg.

Here are some questions I hope they ask:

For Eddy Cue:

  1. Why is there no app store for Apple TV? Even though the product is running essentially the same hardware and software as the iPhone and iPad and iPod touch and even though it connects to the iTunes stores, there is no option for developers to build apps for it or for consumers to use their TVs to run iOS apps. I might add that it’s been seven years since the platform launched and that’s a long time to wait.
  2. As Amazon has been granted a monopoly on the distribution of ebooks by the US federal government, why not compete by selling ebooks as apps? Apps were used as ebook containers well before the iBookstore launched and there were tens of thousands of “book apps”. Why not encourage authors and publishers to build apps by offering tools which make it easy to do so? I might add that if you do this for authors, why not do it for musicians and video producers? Why have separate stores for different media when they are all just content?
  3. YouTube is becoming the TV of choice for millions. Before it becomes that choice for billions, what are you doing to encourage user-generated video content distribution through your ecosystem?
  4. Apple’s Services revenues are growing remarkably quickly. The number of users is over 800 million. Do you see an opportunity for services to become a more independent business at Apple? In other words, why not bring iTunes to Android?

For Craig Federighi:

  1. Marc Andreessen uses the phrase “Software is Eating the World” to describe the disruption that software-enabled businesses are having on those who don’t depend on software. You are the head of software at Apple; what’s on your plate? In other words, what do you see the opportunity for software at Apple beyond enabling device sales? I might add that although you are leading Software Engineering at Apple, Software and Services are part of Eddy’s organization. Does this separation make sense?
  2. It’s likely that iOS will be used by more people than Windows in the near future. What do you see as the obstacles to iOS replacing Windows for what most business users use daily?
  3. If you believe that iOS can replace Windows (at least in some tasks), do you think the iPad will ever replace the Mac?

This was originally posted on LinkedIn on May 28th.

Who Solved the Capitalist’s Dilemma?

In The Capitalist’s Dilemma, Clayton Christensen and Derek van Bever introduce a powerful new theory which explains the relative paucity of growth in developed economies. They draw a causal relationship between the mis-application of capital in pursuit of innovation and the failure to grow.1

In particular, they observe that capital is allocated toward the type of innovations which increase efficiency or performance and not toward those which create markets (and hence long term growth and jobs.) This itself is caused by a prioritization and rewarding of performance ratios rather than cash flows and that itself is due  to a perversion of the purpose of the firm.2

For this statement of causality to be confirmed we need to observe whether it predicts measurable phenomena. For instance, we need to see whether companies which create markets apply capital toward market-creating innovations and whether companies which create value through efficiencies or performance improvements hoard abundant capital.

Over the entire global economy, the pattern of capital over-abundance is easy to see. The amount of cash or securities on balance sheets is extraordinary and unprecedented (estimated at $7 Trillion, doubling over a decade). However, growing cash is not a perfect indicator of inactivity. Cash is the by-product of earnings after investment. So if operating profits are growing and investment is growing, but not as fast, then it’s possible to grow cash while still growing investment.

The better measure is investment in capital equipment or, more specifically, purchases of plant, property and equipment.3 Indeed, on a global scale, capital expenditure as a percent of sales is at a 22-year low.

CapEx is a good proxy for non-financial “investment”. It’s also a measure that can be easily obtained as companies report this activity in their Cash Flow Statements.

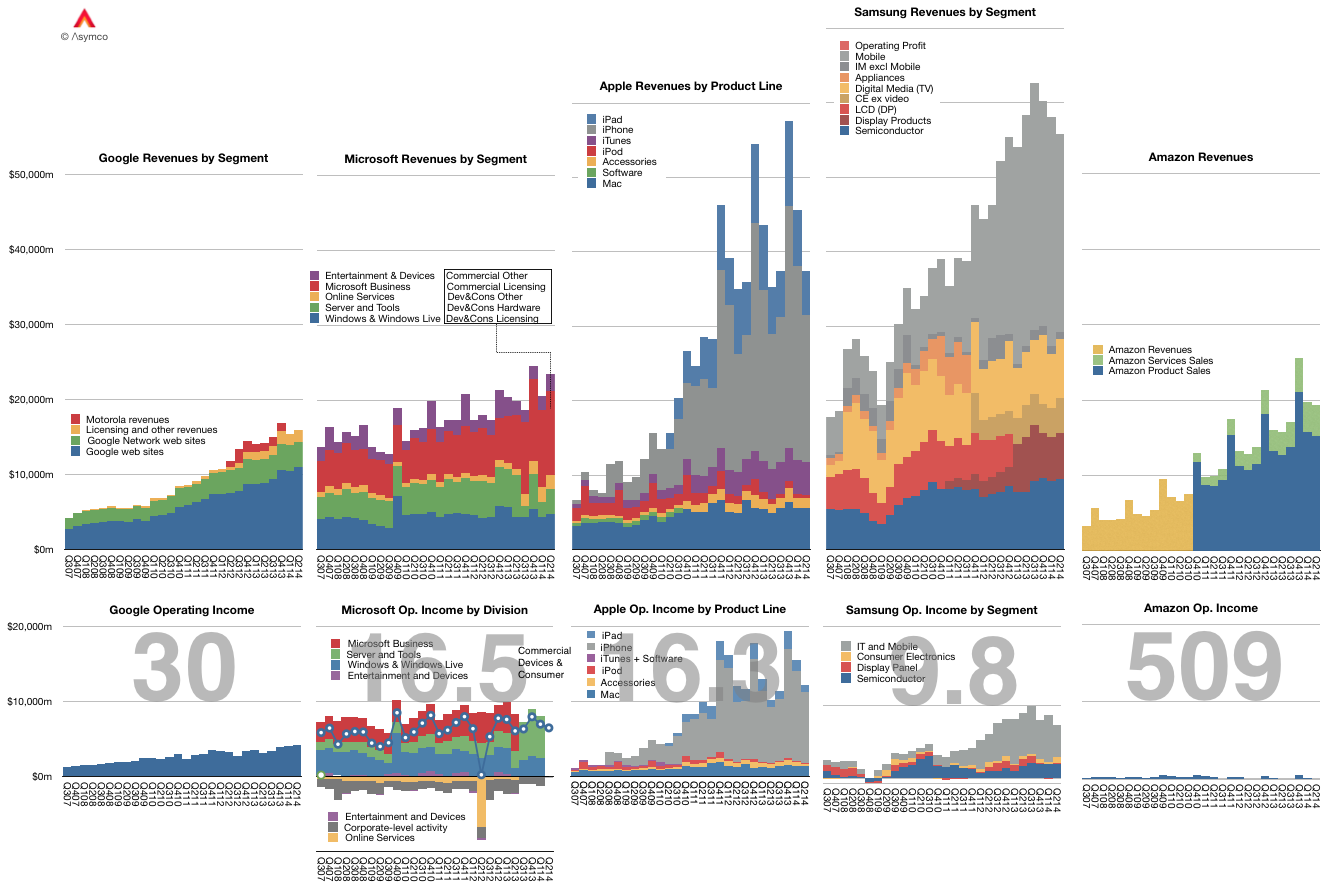
So the best method for assessing the theory’s predictive power is to look at market creators and measure their investment in PP&E. At the same time we need to look at market sustainers and measure their (probable) lack of investment in PP&E.

So here is my first attempt:

Screen Shot 2014-05-27 at 5-27-3.25.43 PM

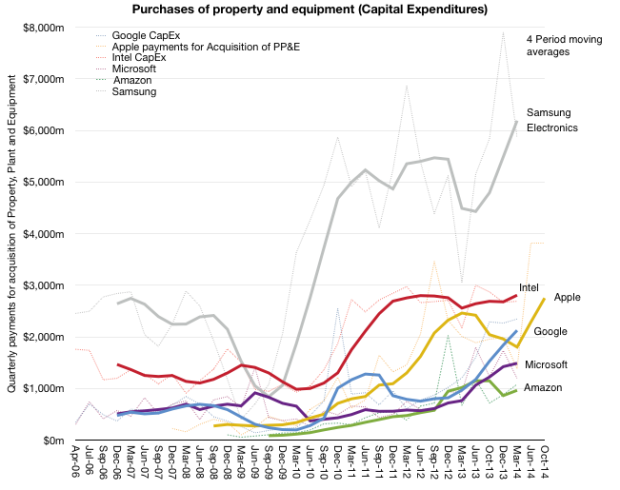
It’s an admittedly small sample of companies that are not that dissimilar. But within this group, over the time frame of about 9 years, we can see how capital expenditures are growing.4 This sample shows that for a few companies, the amount spent on capital equipment grew dramatically. Especially since they are in businesses that might be thought of as not capital intensive.

Continue reading “Who Solved the Capitalist’s Dilemma?”

  1. and, indirectly, in the increase in inequality and hence the destabilization of socio-political institutions []
  2. That being the creation of customers not shareholder returns []
  3. Operating expenditures can also be measured but they cannot grow inorganically due to most of the costs being related to skilled employment which has supply constraints. []
  4. Note that Apple’s data extends to the end of their fiscal year and reflects their forecast given last October in the 10-K filing []