Last week Frank X. Shaw, VP of corporate communications at Microsoft stated:
… most of the people around me were using their iPads exactly as they would a laptop – physical keyboard attached, typing away, connected to a network of some kind, creating a document or tweet or blog or article. In that context, it’s hard to distinguish between a tablet and a notebook or laptop. The form factors are different, but let’s be clear, each is a PC.
Actually this “admission” that iPads are PCs is not something new. Steve Ballmer made the same assertion in 2010 pre-iPad (though calling them slates). Arguably, the notion that tablets are PCs has been dogma at Microsoft for over a decade and Windows running on all form factors has been a strategic guiding principle.
Which is why I’ve always added the tablet data to the PC data to create a picture of the “personal computing” market. And this is what that picture looks like today:
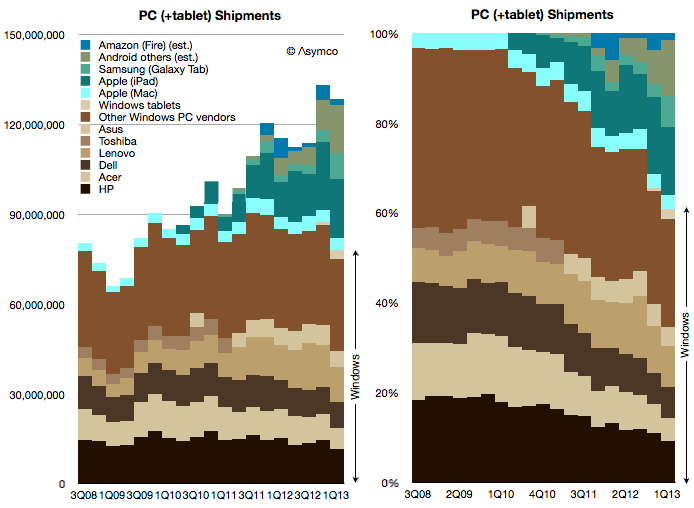
Note how the share of various platforms has evolved over this brief time span: Continue reading “Forecasting Windows market share”