In previous posts I described the patterns of asset value growth for Property Plant and Equipment at Apple and how that change has been thus far correlated to the production of iOS devices.
The analysis was based on looking at the declared value of the PP&E assets on Apple’s balance sheet. These values include depreciation so they reflect not only the “spending” on new assets but also the value lost due to wear and tear. As such it’s not a perfect measure of investment.
The better approach is to use declarations on the cash flow statement. Apple reports a specific cash flow related to PP&E: Under Investing Activities, Payments for acquisition of property, plan and equipment.
In the latest 8-K the amount for the 12 months ended September 29 the value was $8.295 billion.
Compare this with the statement in the Annual Report from one year ago:
The Company anticipates utilizing approximately $8.0 billion for capital expenditures during 2012, including approximately $900 million for retail store facilities and approximately $7.1 billion for product tooling and manufacturing process equipment, and corporate facilities and infrastructure, including information systems hardware, software and enhancements.
Compare also with the PP&E net asset value on the Balance Sheet currently at $15.452 billion but valued at $7.777 billion a year ago (an increase of $7.7 billion).
This means that Apple intended to spend $8 billion, actually spent $8.3 billion and realized a net asset gain (after depreciation) of $7.7 billion.
So there are no major surprises. The spending was only about 4% above expectations a year earlier.
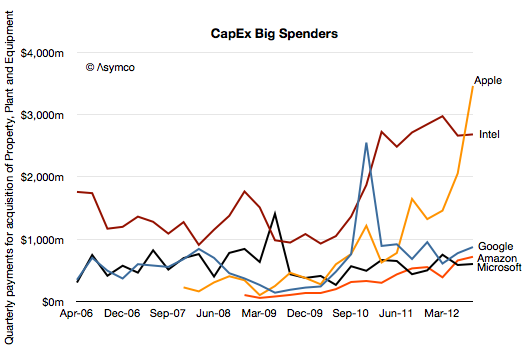
The other pattern to observe is that the spending rose dramatically into the fourth quarter. The fiscal quarterly spending was:
- $1.32 billion
- $1.46 billion
- $2.06 billion
- $3.46 billion
I illustrate this pattern (and previous quarterly spending) in the following chart.

The question remains what is this $8.3 billion being spent on? Continue reading “Hey Big Spender”


