5by5 | The Critical Path #9: Getting To Know You

Dan and Horace talk about some of the more profound implications of “intelligent assistance” in personal devices both in terms of business models and in terms of industry dynamics. Getting assistance is an implied bargain we all make as internet citizens but what do we pay for that assistance?

via 5by5 | The Critical Path #9: Getting To Know You.

This got a bit deep.

Let's talk 'Let's talk iPhone' on 5by5.tv

Thirty minutes after the end of the ‘Let’s talk iPhone’ event, 5by5.tv will be hosting a set of commentators[1] giving initial impressions of announcements.

“Tune-in” at http://5by5.tv/live

I’ll update this post with a link for the download once available.

[UPDATE]

Dan Benjamin talks about Apple’s “Let’s Talk iPhone” event with Dan Moren, Marco Arment, John Siracusa, John Gruber, Horace Dediu, Arnold Kim, and Christina Warren. Topics include the iPhone 4S hardware and form factor, the iOS update, the “geek letdown”, Siri, iPods, pricing, release dates, AppleCare, carriers, serious stats, iCloud and iTunes Match, the non-geek response, and more.

Download the episode here.

  1.  @marcoarment @asymco @arnoldkim @dmoren (@gruber & @jsnell if avail)

Sprint's gamble

The Wall Street Journal reported that Sprint Nextel made a “multibillion-dollar” gamble on the iPhone. This is based on information that Sprint committed to buy 30.5 million iPhones over the next four years.

Wall Street Journal reporters calculated that the deal is worth around $20 billion on the basis of iPhone ASP during the last quarter (about $650). That Sprint would get that price is possible but not necessarily correct as there is likely to be some discount and the ASP Apple receives includes accessories.

But the “gamble” is more than the deal value. The way it’s being reported is that Sprint bet the company on being able to sell this many iPhones. So naturally we have to ask: how hard can it be to sell 31 million iPhones?

First, note that the order is over a four year period. It’s also not likely to be linear, with volumes accelerating over time. If I estimate a ramp where in year one the commitment is for 4 million, year two 6, year three 9 and year four 12 million we get a total of 31 million. Can Sprint sell this volume?

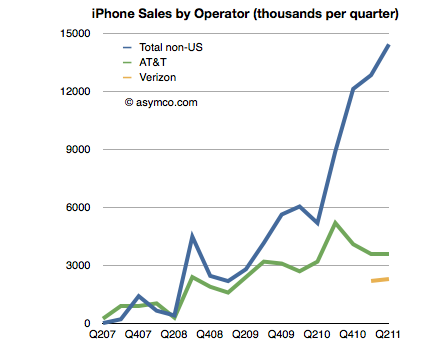
To get an idea we can look at the sales rates for the other US operators. I built a table of iPhone sales by Operator last July. The data is shown in the following chart:

What is interesting is to see the number of iPhones sold in a given time frame as a percent of subscriber base. Continue reading “Sprint's gamble”

iOS vs. Microsoft: Comparing the bottom lines

I began comparing Microsoft and Apple’s financial performance with a review of “top line” or revenues by product lines over a four year period.

This post is about the “bottom line” for the same companies and products.

Before I jump in I would like to make sure there is no confusion about the terms. I will be comparing “operating income”[1] as a measure of “bottom line”. This is a common way to compare the profitability of companies because it excludes taxes and interest income. These non-operating expenses/income can distort a comparison of performance because they can be the result of investment activity or changes in tax law or where the company is domiciled. One should not make judgements of comparative performance on those non-operational bases.[2]

Another challenge is that some companies report operating income by division while others don’t. We can usually compare overall operating income but usually not on a division or product-level. This is the challenge I will try to overcome in this analysis between two very different operating models.

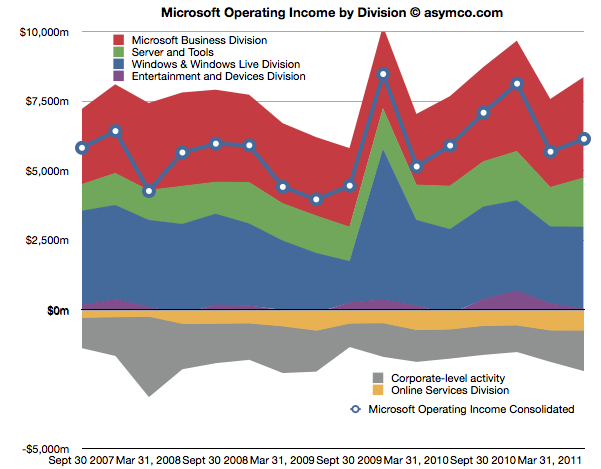
The first chart shows Microsoft’s Operating Income by Division as reported by the company.

Each area represents a business division. Note some are showing negative income (losses). Continue reading “iOS vs. Microsoft: Comparing the bottom lines”

The case against the Kindle as a low end tablet disruption

In an Harvard Business Review post Rob Wheeler makes the case for the Kindle Fire as a disruptive innovation. I believe that it is but crucially I disagree that the Kindle Fire is a low end disruption.

My assessment of the Kindle Fire is based on the two attributes which Amazon highlights as the key selling points which offer a basis of differentiation and potential for asymmetric competition: a low price and a new browsing model. I believe that these two attributes result in two opportunities: one for low end disruption and another of new market disruption. I reject the first and tentatively support the second.[1]

The price

It’s immediately obvious that the price point of the Kindle Fire is well below alternatives. That forms the basis of disruptive potential, but before we jump to analyzing the disruption hypothesis we should determine whether and to what extent Amazon profits from the device directly. Profitability gives us a clue to where Amazon will apply resources and thus establish its trajectory of improvement.

We know the margin on the Fire is low because we can calculate the bill of materials for 7″ tablets. Gene Munster of Piper Jaffray estimates that Amazon “loses” $50 for each unit sold. We also know that the design Amazon used is essentially very similar to the RIM PlayBook and was sourced from the same ODM. RIM priced the product at $499 but has struggled to find buyers and is reluctantly dropping the price. We also can estimate that Apple with a product having more than twice the screen size is keeping modest (~30%) gross margins for at a price point approximately double that of the Fire. It does seem that Amazon does not have much or any margin to dip into.[2]

So the Fire can be classified as a low price product. Does that make it a low end disruption?

Continue reading “The case against the Kindle as a low end tablet disruption”

Comparing top lines: Apple vs. Microsoft

I’ve been providing analysis of Apple’s operating and financial performance for some time. Recently we’ve begun to look at comparisons of financial performance for comparable companies. Now it’s time to dig deeper and do comparisons of operating performance as well.

To start, Microsoft.

Whereas Apple has product lines (iPhone, iPad, iPod, Mac, iTunes, Peripherals and Software), Microsoft has business divisions (Windows & Windows Live, Server and Tools, Online Services, Business (Office), Entertainment and Devices). The charts show revenues for both Apple and Microsoft according to these defined segments.
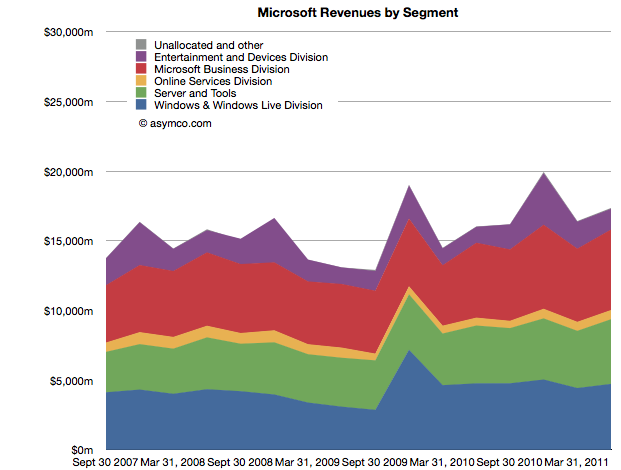
 

The second chart should be a familiar one:
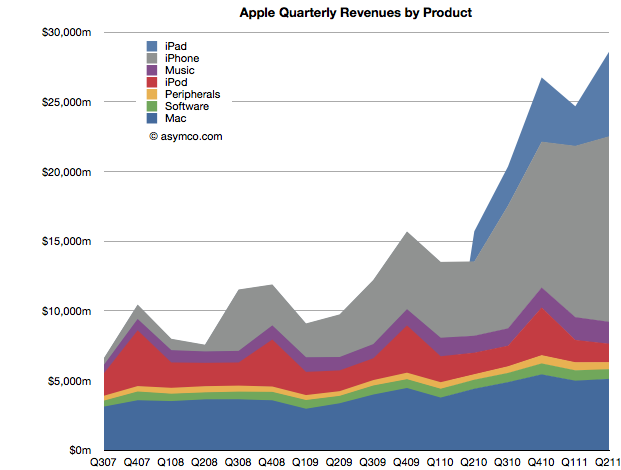
Note that the horizontal and vertical axes are the same. The period of coverage is from mid-2007 to the end of June 2011 which corresponds to the life of the iPhone. The vertical axis ranges up to $30 billion/quarter in both charts.

When shown this way, the exceptional growth for Apple becomes easier to understand (and perhaps Apple’s valuation premium of 15.7 P/E vs. Microsoft’s 9.5). Microsoft has been growing these past four years but not nearly at the rate of Apple. Microsoft grew quarterly revenues from the ~$15b range to ~$17b range.

Additional points of interest:

  • The Mac business generates more Revenue than Windows
  • iOS powered devices generate more revenue than all of Microsoft’s products put together
  • Apple’s revenues grew 413% since Q2 2007 while Microsoft’s grew 26%
  • The release of Windows 7 had a marked effect on revenues in the launch quarter but the sales did not seem to grow above the previous version’s run rate ($4.2b/quarter vs. $4.7b/q on average).

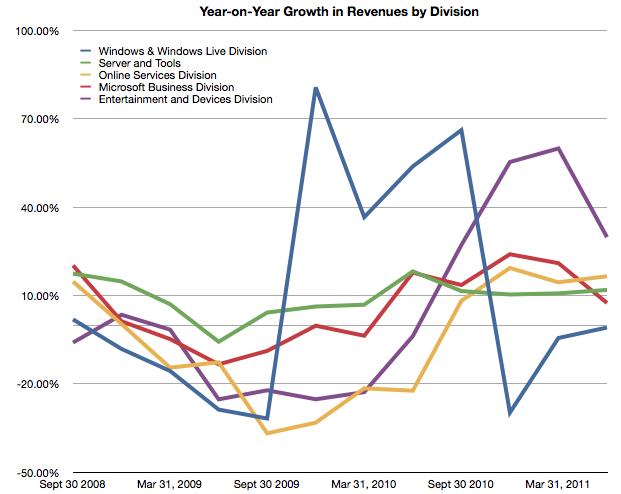
But most importantly, whereas Apple’s growth has come from new businesses (iPhone and iPad), Microsoft has organically grown existing businesses. The condemnation of leadership at Microsoft should hinge on the absence of significant top line growth. Note that neither the Online Services nor the Entertainment and Devices divisions had appreciable net growth.
 

5by5 | The Critical Path #8: In Memory of Robert Boyle

Episode #8 • September 28, 2011 at 2:00pm

Horace and Dan talk about why CEOs are paid so much and what analysis has come to mean in equities research and the value of cross-pollination between the camps that form around technology companies.

5by5 | The Critical Path #8: In Memory of Robert Boyle.

When will Apple's share price reach $500?

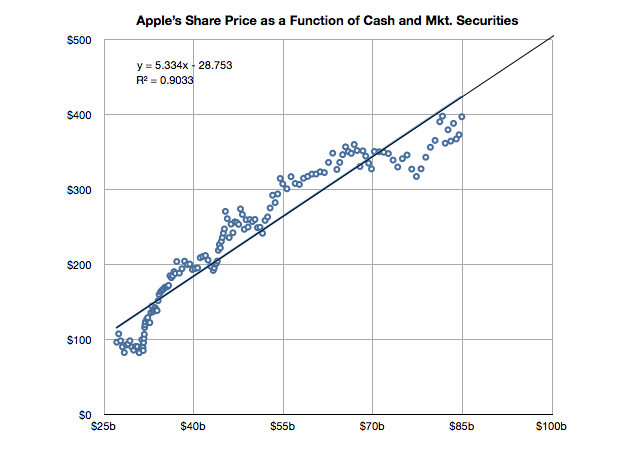
Apple’s share price has recently hit a new all-time high, over $400 per share. As often happens there was no specific new information from the company to justify this increase. On the other hand there is usually no news to justify share price drops in Apple. In fact, the stock is up on what would be considered counter-indicative news: the resignation of a very important CEO.

But readers may recall that there is a measure of performance for Apple we can turn to that seems to show strong correlation to its stock price. It’s not income and it’s not growth in income but it’s the strength of the balance sheet.

I demonstrated this relationship last May with a post titled The market values Apple’s balance sheet, not its income statement.

It’s time to look at the data again to see if the relationship still holds. I added the data for Q2 and made some estimate about the cash position since July 25th (we will know this data with more accuracy when Q3 data is reported in a few weeks).

The slope of the line above has decreased slightly but a strong correlation can still be observed. Continue reading “When will Apple's share price reach $500?”

Decoding Steve Jobs: Select Commentary from HBR.org – Harvard Business Review

Announcing a new HBS PRESS BOOK

Decoding Steve Jobs: Select Commentary from HBR.org

by Norm Smallwood, Kate Sweetman, Dave Ulrich, Rosabeth Moss Kanter, Jeffrey Pfeffer, Horace Dediu, James Allworth, Max Wessel, Rob Wheeler, Bill Taylor

Source: Harvard Business Press Books

14 pages.  Publication date: Sep 22, 2011. Prod. #: 10973-PDF-ENG

“The news of Steve Jobs’s retirement from Apple may be losing steam but observations on his legacy – and Apple’s leadership future – are only beginning. In recent years, leading thinkers have contributed their thoughts on the Jobs phenomenon on HBR.org. We’ve compiled a few of the best here, and we invite you to read them through the lens of business lessons to be learned.’ We’ve selected six pieces: two from after Jobs’s August 2011 announcement and four from before. We hope you will enjoy them, learn from them, and continue to turn to HBR.org for ideas and inspiration.

Available for download for $1.99 via Decoding Steve Jobs: Select Commentary from HBR.org – Harvard Business Review.

5by5 | The Critical Path #7: Genericized Trademarks

5by5 | The Critical Path #7: Genericized Trademarks.

Episode #7 • September 21, 2011 at 12:00pm

Horace and Dan look at brand theory and decide it should not be left to the experts. Also, we ask what jobs products are hired to do and tie that to the meaning imparted in the brand and visual imagery associated with it.