For more analysis of Apple & the industry, join us at ACTIVE 2025.

Apple could buy the mobile phone industry

The second quarter ends in less than two weeks. When it does, I expect Apple will have over $70 billion in Cash, Cash Equivalents, Short-term marketable securities and long-term Marketable Securities. That figure has been growing predictably.

Also predictable has been the decline in value of Apple’s mobile phone competitors. Most spectacularly Nokia and RIM. The enterprise values of the public companies selling 75% of all phones sold world-wide are as follows:

  • Nokia $22.6b
  • RIM $13.8b
  • HTC $25.4b
  • Motorola Mobility $4.2b

The values of the profitable phone-making subsidiaries are a bit more difficult to estimate but we can use multiples of trailing operating profits. I generously use the multiple applied to HTC (14).

  • Sony Ericsson $0.21b x 14 = $3.0b
  • Samsung $3.76b x 14 = $53b

That leaves valuing LG’s phone business which has not been profitable in the last four quarters. I assume a nominal value of $10b. These data points are shown in the following chart: Continue reading “Apple could buy the mobile phone industry”

The app industry vs. the music industry

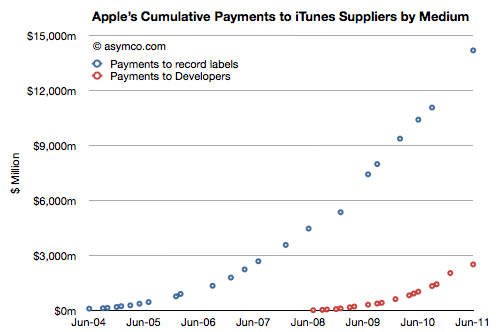
By my estimate, Apple has paid out $16.6 billion to content owners. $2.5 billion to app developers and about $14 billion to music companies. The developer payments are published by Apple, the music payments are estimated based on total downloads and guesses about the split and pricing of that content (90% for the content and $1 to $1.2 average pricing over time.) There might be reason to move the music figure up or down but the difference will still be nearly a factor of 5.

The cumulative payments are shown in the following chart:

Continue reading “The app industry vs. the music industry”

iPhone liquidity: Why an unlocked Phone in the US matters

The iPhone is now available in the US unlocked. Judging by the lack of reaction to the news, one would assume that this is not a significant event. I would argue however that it’s a very significant event.

What is unappreciated is that the iPhone is a very restricted product. Unlike any of Apple’s other products (iPod, Mac and iPad), the iPhone is designed to be hard to get. Apple did not make it easy in the one dimension of ease that matters most: its purchase.

Consider that many people in the world cannot buy an iPhone because it’s not available locally. In case it is, in most cases you need to sign a contract and commit to a long-term relationship with a company other than Apple. In those cases where you don’t sign a contract, you cannot use it with a service provider other than the one (arbitrarily) chosen for you.

A few have been able to buy iPhones unlocked if they lived in a few countries (UK, France, Australia, Belgium, Hong Kong[1]) but those phones could only be purchased online if sent to a local address or in an Apple retail store–of which there are not many.

Consider that in Europe alone, the following countries do not have iPhone distribution:  Continue reading “iPhone liquidity: Why an unlocked Phone in the US matters”

iTunes now costs $1.3 billion/yr to run

The iTunes store continues to grow. The data that Apple published in the last event included the following:

  • 15 Billion iTunes song downloads
  • 130 million book downloads
  • 14 billion app downloads
  • $2.5 billion paid to developers
  • 225 million accounts
  • 425k apps
  • 90k iPad apps
  • 100k game and entertainment titles
  • 50 million game center accounts

As this data is added to the existing data and cross-referenced additional insight into the economics of iTunes is emerging.

Continue reading “iTunes now costs $1.3 billion/yr to run”

Getting to one billion iTunes accounts

There are 225 million iTunes account holders. 25 million joined in the three months. As the iTunes store has been operating since April 2003 it’s possible to step back and look at its history and measure the rate of growth relative to other ecosystems.

The following chart shows various platforms/ecosystems in terms of adoption. In the case of phone operating systems and consoles, the cumulative units sold is shown. The scale is 10 years by 1 billion users with users measured on a logarithmic scale. Continue reading “Getting to one billion iTunes accounts”

Android developers are more prolific but less persistent than iOS developers

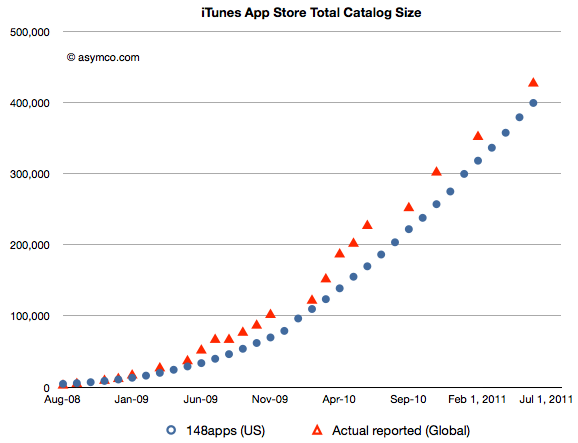
According to 148apps.biz, the App Store has seen over half a million apps since inception. The number of available apps, according to Apple, is now 425k. (148apps claims 402k apps available in the US store.) The history of the App store catalog is shown in the following chart (showing both US and World-wide measures).

In an interesting new post by Appsfire, APPtrition – or why app store size does not matter that much… Ouriel Ohayon makes a good point: available is very different than accepted. When comparing catalogs it’s important to distinguish between these measures. Apps are published and then unpublished for various reasons. He calls this app attrition and details the reasons it might happen.

What makes this interesting is the contrast between attrition rates on Android’s Market and those on Apple’s App Store. Continue reading “Android developers are more prolific but less persistent than iOS developers”

A new show launched today. Critical Path #1: The Five Year Plan – 5by5

Critical Path #1: The Five Year Plan – 5by5.

Critical Path is a talk show contemplating the causality of success and failure in mobile computing. Using Apple as a lens to look at both telecom and traditional computing markets, we try understand what it means to be great.

In this inaugural episode, Horace Dediu and Dan Benjamin try to weigh the strategic implications of Apple’s WWDC announcements. We take a look at the impact on RIM, operators, Google and Apple’s flirtation with Twitter.

Songs, Books and Apps: What do the three media types tell us about the future of consumption?

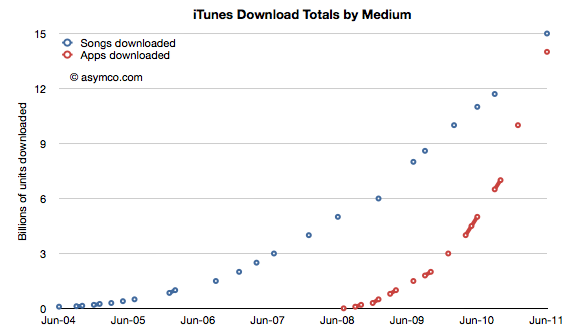
The 200+ million iOS devices have caused 14 billion apps to be downloaded in less than three years. The iTunes music store caused 15 billion songs to be downloaded over a 7 year period.

The two media download totals are shown in the following chart:

About 9 months ago I predicted that Apps would overtake song downloads. I was off on the timing by a few months. The app download rate slowed down in the last few months. However, the crossover point is imminent. The song download rate is running at about Continue reading “Songs, Books and Apps: What do the three media types tell us about the future of consumption?”

Peak RIM

In their monthly survey update on US phone usage, comScore reported that by the end of April 74.6 million people in the U.S. owned smartphones. In the same period a year ago only 48.1 million did. The percent of smartphone users out of total phone users has reached 32%.

The following data points can also be deduced:

  • 2.1 million or 474k people/week became smartphone users during April.
  • 62% of smartphones in use in the US are either Android or iOS. The sum a year ago was 37%.
  • There are about 20 million iPhone users and 27 million Android users in the US today. A year ago there were 12 and 6 million respectively.
  • RIM’s US user base peaked at 22 million in Sept 2010. It is now 19 million and dropping.
  • Usage of Microsoft mobile operating systems in the US is in steady decline dropping from 7 to 5 million users in one year.
  • During April 475,000 people abandoned their Blackberries.
  • Android and iOS gained 3 million users in April. One million switched from other smartphones and 2 million switched from non-smartphones.

The following chart shows the evolution of installed base share of platforms among users of smartphones in the US. Continue reading “Peak RIM”