Asymco reader profile: Mobile technology web software tech developer

The 200 most popular words used to describe the Asymco audience. The data is obtained from 4.3k twitter bios (approximately 55k total words). Generated using Wordle and a bit of Automator, grep, and BBEdit. Click/tap on image for more resolution.

A summary of the attributes of the best audience on the web.

Ascent of the entrants: Taking food from the mouths of giants

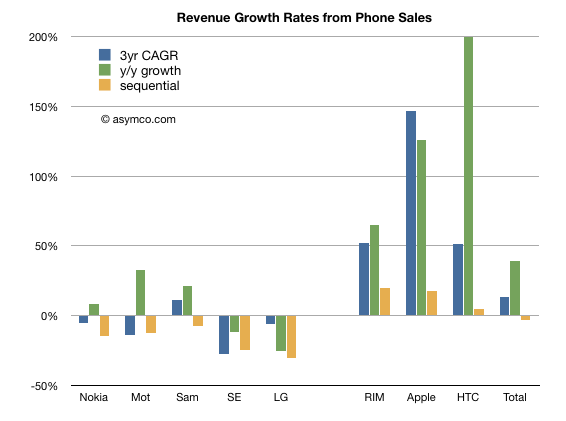
Revenues for the eight phone vendors I track increased overall during the last three years. The compounded annual growth was about 13%.  However the growth was not evenly distributed. The following chart shows revenue growth across three time frames: Three year compounded, year/year quarterly and sequential quarterly.

I separated the incumbent companies from the “entrant” smartphone vendors for contrast.

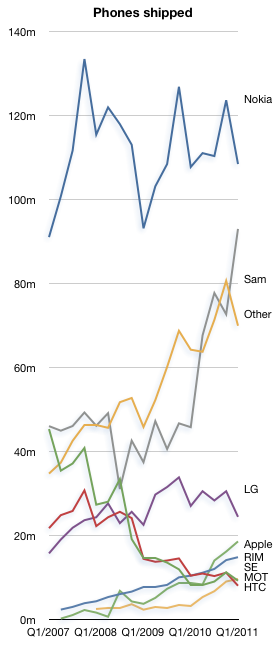
Looking at individual performance, the following chart shows how each vendor performed over time: Continue reading “Ascent of the entrants: Taking food from the mouths of giants”

The end of phone vendor tiers

It’s time to review the mobile phone market at the end of the first quarter of 2011. Before I begin, I’d like to remind that this analysis will span multiple posts and that many details will be published separately due to time and space constraints. Data about platforms, sales, profitability and pricing will be posted separately.

All data sets and chart data will be available for interaction and download through Asymco Interactive when complete. You can purchase a license to Asymco Interactive anytime and you will have access to any new data sets for next 90 days so don’t hesitate to pre-order the report.

The overall phone market grew at a compound rate of 9% over three years. The pattern of entrants focused on smartphones and mobile computing growing faster than the incumbents continues. The compound three year unit growth for the tracked vendors in descending order is:

  1. Apple 122%
  2. HTC 55%
  3. RIM 50%
  4. Samsung 15%
  5. Other 14%
  6. LG 0%
  7. Nokia -2%
  8. Sony Ericsson -29%
  9. Motorola -30%

To give an idea of the split between smart and non smart, Nokia’s smart business grew at 18% compounded while its non-smart units contracted at -6% rate.

In terms of y/y growth the market grew at 26% and the vendor ranking is:

  1. HTC 194%
  2. Apple 113%
  3. Other 103%
  4. ZTE 75%
  5. RIM 42%
  6. Motorola 13%
  7. Samsung 9%
  8. Nokia 1% (smart: 13%, non-smart -2.3%)
  9. LG -10%
  10. Sony Ericsson -23%

Continue reading “The end of phone vendor tiers”

Measuring iPhone progress

Speaking of boats, there were recent claims that the iPhone is “dead in the water“. As someone who has done some sailing I can say that being dead in the water is dangerous. Not only are you not going anywhere but you also don’t have steering control. It’s movement through the water that allows a rudder to work so being stationary means that you can’t orient the boat when waves or wind might threaten stability.

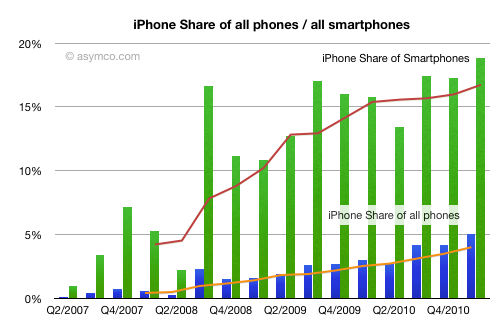
This implied inability to gain directional control is what makes the accusation so powerful. How valid is it? That claim certainly was not made because the iPhone did not grow. iPhone grew at 113% year on year. It even grew sequentially in a post-holiday quarter and the growth is not slowing materially.

The claim was made that iPhone was not gaining share. But share of what? If we look at the iPhone share of all phones and share of smartphones, it’s still growing. It reached 5% share of all phones sold in the quarter and fourth most popular vendor in the world. Beating RIM, HTC, Motorola, Sony Ericsson and ZTE.

So what makes the iPhone dead in the water?

Continue reading “Measuring iPhone progress”

A rising tide does not lift leaking ships

I’ve often said that the smartphone rising tide has lifted many boats. If you were selling smartphones during the last three years, your business was growing, no matter what phones you made.

In fact, measuring success and failure was a matter of deciding what growth rate was “not good enough”. Growing at 30% was nearly enough to shame some vendors into re-evaluating their strategies.

But that sort of tidal growth can’t last. At some point  ships with holes begin to sink no matter what the tide brings.

When we look at the data from the last quarter, we should be asking again whether some ships have developed some leaks.

Continue reading “A rising tide does not lift leaking ships”

Codifying asymmetry: How Apple became Jobsian

Any student of organizational theory must struggle with the question of how to assign weight to the influence of the leadership of a company. In the case of Apple, the question is:

Is Jobs is the embodiment of Apple or is Apple already Jobsian, imbued with his ethos?

John Gruber summed up (start at 8:00 min) the “Apple is Jobsian” argument by saying that Apple is Steve Jobs’ greatest creation and that he has been working on crafting the company as much as he has been crafting products. The result being that it’s well designed for sustainable longevity.

The arguments for “Jobs is Apple” are mostly rooted in anecdotes of a supreme leader that is indispensable to every decision and detail. There are also ample examples from history of companies who foundered after the departure of founders (Apple itself is notably cited.)

But beside armchair quarterbacking, what evidence is there that Apple is being engineered to operate independent of its founder? Continue reading “Codifying asymmetry: How Apple became Jobsian”

Staying Hungry

During the June 2005 Stanford University commencement speech Steve Jobs famously cited the farewell message placed on the back cover of the 1974 edition of The Whole Earth Catalog: “Stay hungry, stay foolish.”

That’s a nice, pithy statement. I interpreted “Being Foolish” in a Quora answer as “being naive about how things should be and thus allowing oneself to see how things could be.”

But what about staying hungry? Continue reading “Staying Hungry”

Phone Tipping Point Countdown Reset

comScore’s latest survey data is in and the news is good.

In March an additional 3 million Americans became smartphone users. That translates to 700,000 every week or 100,000 every day switching from a non-smart or feature phone to a smartphone.

The smartphone is now in use by 31% of the phone users in the US. A year ago 80% of Americans did not use a smartphone. Today non-consumption is down to 69%.

It also means that only 19% more penetration remains before half of the population is using smartphones and that penetration is increasing at an average of 1.3% per month.

I reset my Phone Tipping Point countdown clock to reflect the new data.

I call it the Phone Tipping Point because it’s the moment when I expect we’ll stop using the word “smartphone”.

It’s nearly one year away.

Feature Tablets

Andrian Georgiev, a reporter from the Bulgarian business newspaper “Capital weekly” wrote an article for which he asked me some questions. My answers are below. The article is available here (Bulgarian).
Q: How many tablets will be sold worldwide this year and in 2012?
A: We can only guess the answer. The total will be constrained by parts shortages for 2011, but my estimate [through the end of 2012] is over 100 million. Perhaps even 120 million is possible.

Q: Do you think Amazon is working on a tablet? Could it be a game-changer?
A: If Amazon (or Facebook or Baidu) were to build a tablet the greatest innovation will be in their business models. In other words how they make money. I suspect Amazon’s hardware will be free or nearly free but users will be incentivized to buy content or other goods from Amazon. Similarly for other businesses that will take a hardware product and make it an accessory to their core business. In that regard the “game will change” because hardware will conform to “the application” above it. In other words, that the device will be an accessory to the service, not the other way around.

Q: Why is it so hard for manufacturers to create a tablet that rivals iPad?
A: The iPad is a collection of components. Some are easy to duplicate or to source. This includes memory, microprocessors, communications components. Other components are harder to find and may be expensive once found. This includes the right kind of batteries and the screen. Yet other components are impossible to find or duplicate. That includes software.

Some additional thoughts:

The changing of the game may not happen for some time. “Feature tablets” (analogous to feature phones) will however be viable as niche businesses quite soon. I believe “conforming” operating systems will be more popular with tablet makers than with phone makers.

The trouble with halos

The Mac grew at 28% while the overall PC market contracted at 3%. The Mac has outperformed the PC market overall for 20 consecutive quarters.

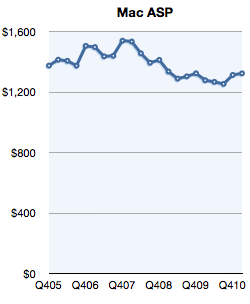
Prices increased sequentially and year-to-year.

I’ve mentioned the increasing shift of Mac mix to portables as a possible reason for the growth of the business. The Mac was one of the first to move to a portable form factor and has been pushing portability over performance for many years.

The following chart shows the relationship between growth and portable mix: Continue reading “The trouble with halos”