For more analysis of Apple & the industry, join us at ACTIVE 2025.

Good, Better, Best

Before the iPhones 8 and X launched I made a prediction on what the iPhone would cost. I concluded that the iPhone price would not change. This is because it has never changed1. Apple collected $767,758,000,000 for the 1,203,732,000 iPhones sold to the end of June or $ 637.8147 per phone.

Of course this is the average price and that average is on a trailing 12 months basis and measures some of the deferrals in income that exist for obscure accounting reasons.

Now that the new iPhones have launched, how probable is my prediction? The first mild surprise is that the total number of phone models has increased to 16. I had no prediction on product count but did not expect the 6S and 6S Plus to remain available. The following graph shows the total number of products in the mix (excluding color variations).

The second surprise was that the iPhone SE has been upgraded in memory from 16Gb/64Gb to 32/128Gb and that the new 32Gb version is $50 cheaper than the old 16Gb. The 128Gb remains priced the same as its 64Gb predecessor.

This means that the SE 32 now occupies a new lowest price band for iPhone: $350. It’s a remarkably capable phone at the lowest price for an iPhone ever. It’s $100 cheaper than the 5C 8 Gb which I bought 3 years ago.

At this point my prediction looks precarious. Continue reading “Good, Better, Best”

  1. Apart from seasonality. Quarterly Minimum = $437, Quarterly maximum = $695, Quarterly Median = $631, Standard Deviation=$58 []

How much will the new iPhone cost?

The answer, regardless of when you ask, is: The same as the current iPhone.

Of course, this is the answer to the question of what will the average new iPhone cost. The average selling price (which combines the revenues and the volumes of all units sold and is reported every quarter) has not varied very much since early 2008. To the degree that there is variance (between $600 and $700) it is due mostly to seasonality and reflects a mix of more expensive units during the launch quarters and a cheaper units during later periods when the product is older and due for an update.

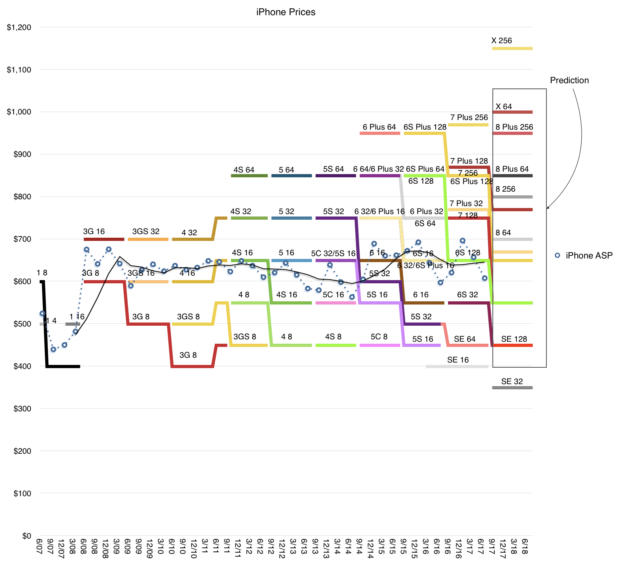
The graph below shows the average selling price as a dashed line and the corresponding prices of individual product variants available for sale in the US during the same time frame.1

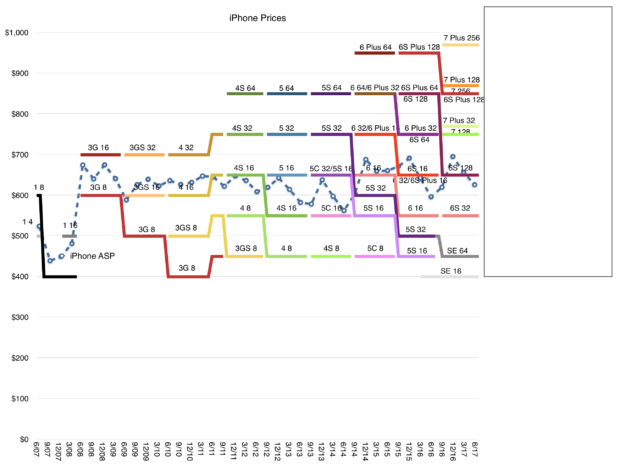
The graph shows a high degree of consistency of pattern: Every year a new iPhone is launched which replaces the one launched the year before. The older product is still offered at a reduced price. Price brackets are very firm and set at fixed intervals about $100 apart.

A few minor changes in pattern over the years can be observed:

  • The original iPhone price changed due to a shift in subsidy model shortly after launch.
  • An increase of $50 mid-2011 when the iPhone became available unlocked.
  • Every three years a new, higher, price bracket is introduced, with a  doubling of maximum memory capacity.
  • The iPhone SE was introduced at a slightly lower price.
  • The last year saw a slight increase in the highest price.

The overall pattern looks like a staircase with a widening price range where the lowest price remains constant and the upper price rises every three years by $100.

The “floor” of the range is a consistent $400 while the “ceiling” has expanded from $700 to about $950.

This year’s ceiling is due for the fourth leg up and if the pattern persists, we should expect it to reach $1100.

This iPhone staircase has been built over 10 years and I don’t see it changing over the next three. I therefore drew the blank box over what I thought would be the price range from now until late 2020.

This is what I call the staircase model of Apple pricing. The staircase model must be understood in combination with the flat iPhone average price as the product matures.

As the product matures the user base grows (to nearly 1 billion today). Later buyers will opt for the lower price points, but the availability of higher, more aspirational models (sustained by the brand) means that a minority will gravitate upward, mainly because they can. This ensures that although the median and mode of the price trend downward, the average price stays the same.

The flatness of iPhone pricing is also to be understood in combination with the flatness of Mac, iPod and iPad average pricing (shown below)

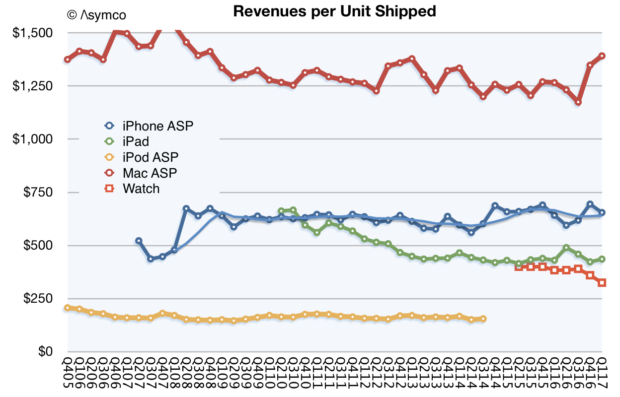
The technique of preservation of average price seems to be in effect across Apple. In other words, the evidence suggests that Apple prefers to keep average pricing for all products constant. Individual variants are priced so that, as the category matures, the changing mix leads to consistency in price ownership.

Thus the iPhone can be seen as controlling the $650 point, the Mac $1200, the iPod $200 and the iPad $450. This pricing signals the product’s value and the value of the brand.

The signaling is not just to buyers but also to competitors. Ownership of price forces competitors to occupy adjacent brackets. This process begins at launch: the new Apple product is introduced in what is perceived as a premium stratum2 thus the reaction from competitors is to “undercut” it. But, as Apple climbs the price staircase, preserving the floor, it keeps competitors bunched up at the bottom. Competing in the same brackets with Apple is futile as other brands can’t sustain the perceived premium position.

The result is a remarkable consistency of average pricing which, coupled with a remarkable consistency of competitive positioning, coupled with a remarkable consistency of customer satisfaction and loyalty, leads to a remarkable predictability of cash flows and ability to invest in new product creation..

Apple is thus quite easily understood as a remarkably consistent consumer products business. The only surprise that remains is how long it takes for that understanding to propagate.


  1. Prices outside the US vary depending on duties, taxes and currency hedging but generally are based on the US price []
  2. See for example the pricing of the new HomePod []

Estimating Apple’s Second Calendar Quarter

Apple reports second calendar quarter results in about a week. I propose the following estimates:

Fiscal Q3 2017:
Rev ($B) 45.321
EPS ($) 1.62
iPhone (units) 41 million
iPad (units) 9.8 million
Mac (units) 4.35 million
Watch (units) 2.5 million
Services ($) 7.2 billion
Other products ($) 2.6 billion
Gross margin (%) 38.4

The revenue estimate is visualized in relation to guidance (revenue between $43.5 billion and $45.5 billion) and shown in the context of previous actual revenues below:p

The estimates are also consistent with additional guidance provided:

  • Gross margin between 37.5% and 38.5%
  • Operating expenses between $6.6 billion and $6.7 billion
  • Other income/(expense) of $450 million
  • Tax rate of 25.5%

The estimates (and guidance) suggest modest growth of 7% in revenues and 13.7% EPS. The predictability of the quarter suggests that attention will mostly be focused on guidance for the next quarter.

Expectations can vary quite a bit because of the effects of a new launch. The product mix, pricing and timing are all unknown at this time.

What is known however is that the customer base for Apple is increasing and loyalty is higher than ever. What I sense, coming from very few data points, is that there are more iPhones in use than ever before. A few years ago when the market was less saturated it was easy to assume that commodity Android phones and tablets would surge and swamp iPhone/iOS usage.

This has not happened, indeed the data suggests that iOS usage is stronger than ever and that there are many more “switchers” moving from Android to iOS than vice-versa.

This may surprise some but if we look at the PC market, a similar phenomenon has been taking place for years. Mac usage grows and Macs are more visible and valuable than PCs.

It’s important to note that in the latter, post saturation stages, the markets for both phones and computers are increasingly driven by brand value. This resistance to commoditization is due to buyers’ perceptions of quality moving beyond utility and of the prioritization by buyers of new measures of performance. These new measures defy measurement.

Much of what is therefore required of market analysts is intuition.

Other Products

From the way Apple reports its revenues you might think that the company has several operating segments. There are the iPhone, the Mac, the iPad for which units and revenues are reported. Then there are Services and Other Products for which we have revenues only.

Services is a collection of all non-hardware revenues and is (finally) being recognized as a non-trivial business. With reported revenues of $26.6 billion in the last twelve months, it’s big enough to be a Fortune 100 company and set to double in four years.1

That leaves “Other Products” which now becomes the revenue segment that is  “most likely to be ignored.” This segment had revenues of only about $11.5 billion in the last 12 months which would place it at only a Fortune 245 ranking, equivalent to a Toys “R” Us or Biogen. How should we value Other Products?

Other includes many hardware products including iPod, Apple TV, Beats, Apple Watch, AirPods and, soon, HomePod. Each is a significant product, with Watch probably the largest single contributor. But since we don’t have specific unit numbers, we are left guessing at the contribution of each.

The Watch itself has been a point of scrutiny as it could be initially teased out of the mix through an observation of the before-and-after launch vs. trend-line as shown below:

This separation of Watch became harder to discern after the launch of AirPods. Though they are still very hard to obtain, they might be “moving the needle” by now with a contribution that would muddy the Other category further. Same with updated Beats headphones.

Continue reading “Other Products”

  1. Although a non-zero business, the valuation of Services continues to confound observers who cannot separate it from the hardware businesses it attaches to–which themselves are considered near commodity value–thus paradoxically valuing the overlying asset of Services near or precisely at zero. Incidentally, Facebook is Fortune 98 at $27.3 billion and it is also one of the top 5 largest business by market capitalization. []

Join the Micromobility Summit in Copenhagen September 6

I’m Happy to announce that I’ll be hosting the Micromobility Summit at Techfestival this year. Taking place on September 6 in Copenhagen, the one-day summit explores how new technologies affect society, cities and urbanization in the very near future.

Join and contribute here

About Techfestival:

This September, Copenhagen will be home to 15,000+ people exploring a new, progressive agenda on technology. One week filled with 100+ conferences, summits, dinners, art installations and concerts, Techfestival’s goal is to break down today’s most complex questions into real talk and tangible experiences.f

Defining the 21st Century

The iPhone is the best selling product ever, making Apple perhaps the best business ever. Because of the iPhone, Apple has managed to survive to a relatively old age. Not only did it build a device base well over 1 billion it engendered loyalty and satisfaction described only by superlatives.

To summarize I can offer two numbers:

1,162,796,000 iPhones sold (to end of March 2017).

$742,912,000,000 in revenues. $1 trillion will be reached in less than 18 months.

But more important than any of these quantifiable measures of success are the unquantified accomplishments. These are the changes we note only when flipping an A/B switch on a decade. The changes ushered by the iPhone have been as momentous as those of the Ford Model T. Or those of electricity, telegraph, radio or TV.

These are epoch-making technologies. They shape the fiber of society and the definition of quality of life. They obsolete entire economies and change the balance of political power. They shift the center of gravity of society.

To glimpse the change you only need to observe how we shifted how we spend our time. The fact that 2 billion people are using Facebook every day. That the device is looked at for 2 hours a day. That it’s unlocked 80 times a day. That it holds almost all our memories and our conversations and all our secrets. That it created new modes of communication and destroyed others, ancient and respected.

That it substituted communications, entertainment, and interaction. That swiping became the most used human gesture. That we communicate with photos and not with words. That, like the voice call, transportation now comes to us rather than we to it. That it can answer to our voice. That we can never be lost again. That it makes us all publishers.

That all this happened while the product itself was always perceived as fragile, vulnerable, copyable, doomed to early demise. That imitators outnumber it 10 to 1. That it somehow found ways to become better even though we exhaust what we can ask of it.

For all these reasons I believe that future historians will point to the iPhone as the technological product that defined the 21st century. Much will follow from it and it may become something altogether different but it set humanity on a new course.

App Story

The App Store is almost 9 years old. In that time it has generated about $100 billion in revenues, of which about $70 billion has been passed on to developers and $30 billion was kept by Apple. It’s very likely that running the App Store for 9 years did not cost $30 billion so, if it were an independent “business unit” it would probably have been and still be quite profitable.

But Apple does not run “business units” with separate Profit and Loss statements. The App Store is a part of Services which is an amalgamation of non-hardware sources of revenues but that does not mean it’s a business. The purpose of Services isn’t to turn a profit or define its value through some metric of financial performance.

The purpose of Services is to make the experience for the Apple user better. The combination of good experiences allows Apple to be perceived as a valuable brand and that allows it to obtain consistently above-average profitability through pricing power. I like to emphasize that the iPhone at over $600 in average price is more than twice the average price of all the other smartphones and captures over 90% of all available profits.

This is something that remains after a decade and indeed the price is rising in the face of overall price erosion, all without a decrease in volumes. The sustainability of this exceptionalism is due to no one single thing. It’s due to the persistence across all the things Apple does: product, stores, software and services and many other details too numerous to count.

The result is a large and expanding base of satisfied customers and a large and expanding base of partners both in hardware and software and services. The WWDC event this year showed how the ecosystem of Apple is booming with over 3 million new developers and Keynote screenfuls of partnerships. All this makes for a complex picture but it’s a real picture.

The latest numbers on Services try to tell this story: 180 billion App downloads from 500 million App store weekly visitors. The download rate is accelerating as shown in the following graph:

The revenue or payment rates can also be shown as accelerating though at a different rate. In both cases, the story of apps is not yet over, regardless of commentary to the contrary. Much of this growth comes from new markets like China and as India joins the iOS world, there is yet more opportunity emerging.

This enables part of the story of Services which can be tracked with several other metrics: reported revenues, iCloud accounts, active devices, and iTunes accounts are highly correlated.

The patterns after a decade are remarkably consistent. One would have thought that with mobile saturation in advanced markets, the content story would be told through horizontal lines. What we still see is the same slopes we’ve seen since the earliest days.

But the biggest story at WWDC was the re-design of the App Store as a curated content market. The changes are profound: discovery, curation and the surfacing of content have been revamped. It’s hard to predict the implications of this but one of the indications of direction was the separation of “Games” from “Apps”. This is a jarring idea since if all Apps are content, what makes Games different from other Apps? Is this a genre elevated to a new medium?

I can’t yet get a sense of where this is heading, if anywhere, but the remarkable story of Apps is that it’s still an ongoing story. We may be on chapter 2 and we can’t predict how many chapters remain.

Keep an eye on Apps and Services and developers. They are not lagging indicators of success for Apple. They are very much leading.

Predictably Profitable, Unpredictably Valuable

Predicting Apple’s yearly revenues has been fairly easy. The following graph shows the relationship between budgeted spending on Machinery, Equipment, Internal-use software, Land & Buildings and the shipment of iOS device revenues.

The company conveniently publishes a full-year forecast of these expenditures every fiscal year so by October we know roughly how sales will be during the following year. This pattern has held for 10 years so there is little uncertainty about the 11th year of iOS devices.

Continue reading “Predictably Profitable, Unpredictably Valuable”

Predicting The Second Quarter

The last quarter of 2016 was Apple’s biggest ever. $78.4 billion in revenues. 78.3 million iPhones. Both records. Earnings of $3.361 and cash reached new highs. The growth was modest but Services is now not just the second largest revenue but also the fastest growing, on track to doubling in four years.

The reason for this is the vastness of Apple’s user base coupled with the loyalty the brand engenders. The company reached one billion active devices more than a year ago and is quite likely to have nearly a billion users. Not just any billion either–the best billion most probably.

The realization that Apple benefits from extreme quantity and quality of customers has led some observers to defer the imminence of Apple’s demise. Share prices have risen lately to new highs and the ratios between these prices and earnings have started to come closer to the average of other large companies.

But enough with the reductio ad absurdum. Let’s look at the next quarter. The company has been very precise with its own offered predictions (guidance) so it’s a simple task to make an accurate forecast. The history of guidance vs. outcomes for revenues is shown below:

Placing the pipper on the upper edge of the guidance range was a safe targeting method for 11 of the last 17 quarters. We have never seen a drop below the bottom of the range but had a few overshoots, some huge. Doing this for the latest quarter and working backwards to the individual product contributions to revenue and using historical margin and cost patterns we can get the following core financial performance metrics:

Fiscal Q2 2017:
Rev ($B) 53.4
EPS ($/share) 1.96
iPhone (thousand units) 53100
iPad (thousand units) 9900
Mac (thousand units) 4100
Watch (thousand units) 2300
Services ($ million) 7129
Other products ($ million) 2300
Gross margin (%) 37.8

I sent these estimates to Philip-Elmer DeWitt and I recommend looking at his survey of the other analyst estimates on his excellent Apple 3.0 blog.

Overall, the quarter is shaping up to offer slight growth y/y and indicating a plateau formed after the surge from the iPhone 6 surge in ’15. All eyes are on the “super cycle” for the next iPhone.

The reason it’s “super” is that the iPhone has a 2+ year cadence for form factor changes and the user base updates on a similar cycle. The demand is vast due to the user base and accumulated age of devices in use. Expectations are that supply will be offered to meet this demand.

If history is a guide then the next iPhone will be the best iPhone ever.


  1. On shares priced at the time around $105 or 3.2% yield quarterly earnings []

Asymco

Asymmetric Competition

Skip to content ↓