Unix's Revenge

With QNX now firmly roadmapped at RIM and Android spreading among vendors like a virus, I wanted to point out that these operating systems share one ancestor: Unix.

A technical triumph

Technically Linux, which underlies Android, among others, is walled off from Unix from an IP point of view, but the philosophical and architectural lineage goes back to 1969’s Unix. It was an amazingly well thought-out operating system which has stood the test of time mostly due to its modular architecture. It was not always clear that Unix would make it this far, and in many ways it was written off. Continue reading “Unix's Revenge”

Correlating Innovation and Share Prices

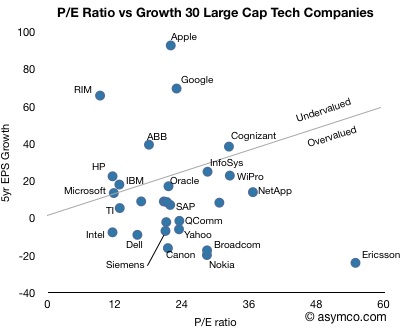
In the last article on the P/E ratio vs. Growth for some of the largest companies, the question of PEG came up. PEG is the P/E over Growth and it’s a good way to index valuation relative to growth. Usually Growth is measured as the forward twelve months consensus and a PEG of 1 is, as a rule of thumb, considered “fair value”. However, forward growth is based on possibly inaccurate analyst consensus. If we instead look at historic growth, we have some actual performance to evaluate. Let’s call this PEhG for P/E over historic Growth.

The following chart shows 30 large cap technology companies[1] and their five-year compound EPS growth vs. their current P/E multiples. If we draw a line at the PEhG of 1, i.e. when the P/E ratio is equal to the historic growth rate and split the pack into PEhG > 1 (overvalued)[2] and PehG < 1 (undervalued), we have the following split:

The chart makes for an interesting Continue reading “Correlating Innovation and Share Prices”

Amazon App Store For Android

Yep, Amazon Launching Their Own App Store For Android Too.

No surprises here. Amazon, a retailer, is building a retail experience for apps. They are taking Android and throwing away Google’s app store and a few other things as well and making their own tablet while at it.

Maybe they’ll put Bing on it and Facebook too.

WebOS: HP, and HP Only. QNX: RIM and RIM Only

WebOS: HP, and HP Only.

With the launch of RIM’s tablet computer based on QNX and HP’s confirmation that WebOS will not be licensed, we have

  • Apple the largest tablet and music player company,
  • HP the largest PC company,
  • RIM the largest smartphone company in the US, and
  • Nokia largest smartphone company in the world

avoiding Android.

These are the companies which today are profitable and enjoy large market shares. Why did they choose integrated (aka “closed”) software with their hardware vs. the modular (aka “open”) approach offered by Google and Microsoft?

See also: asymco | Android’s Pursuit of the Biggest Losers

Morgan Stanley analyst predicts Microsoft will buy its way to triple smartphone market share in 2 years

“You could buy your way in, if you are Microsoft,” he said. “This is a market where a deep balance sheet will help Microsoft determine where they want to go.”

He notes a good marketing campaign can do wonders for adoption, with Ehud predicting Microsoft will hit 15% market share in 2012 (about the same as the iPhone’s share now)

“With [Microsoft’s] resources, I think they can sustain double-digit market share,” he said.

He notes Microsoft, with $36.8 billion in the bank, could win market share in multiple other ways, including subsidizing phone costs.

He still however predicts Android will lead the pack with 30%, Apple next with 25%, and RIM, Nokia and Microsoft all having 15% of the market.

via Morgan Stanley analyst predicts Microsoft will triple smartphone market share in 2 years.

There you have it: users are so easily persuaded that a platform purchasing decision can be acquired via small outlays of cash for ads and subsidies for vendors and operators.

The Symbian open source experiment has failed

ZDNet reports Sony Ericsson are abandoning Symbian for Android, and Samsung headed down the Android and Bada road a while back. There are precious few device manufacturers remaining as foundation members, e.g. ZTE, Sharp and Compal, none of whom are exactly trend-setting industry leaders.

via The Symbian open source experiment has failed [Gartner].

I was going to ask what happened to ‘Open always wins?’ but decided against it.

What I will say is that open sourcing Symbian was not a new beginning for the platform but the beginning of the end. I don’t think anybody seriously considered it a viable multi-vendor platform, least of all Nokia.

How much did Google pay for distribution on the iPhone?

I’m willing to bet that Google pays between $5 to $10 per iPhone for the privilege of default search. I think that’s where Schmidt got the figure for what Android is worth. It also makes sense given the rumor that surfaced that Google paid $100 million for the default search placement in the first round.

Via Appleinsider: Google extends deal with Apple to remain default iPhone search.

NYT blames yet another culprit: Nokia’s Culture of Complacency

“I am sure there are things we could have done better and innovations we missed,” Ms. Suominen added. “But that happens to all companies. We have been very successful with some other innovations.”

She cited Nokia’s large patent portfolio and its 770 Internet Tablet, a compact, flat-screen device without a phone, released in 2005. It worked with a pen stylus and was made for Internet browsing but is no longer sold.

via Nokia’s New Chief Faces a Culture of Complacency – NYTimes.com.

If I may suggest a better list of innovations for Nokia to stand behind:

  1. The first GSM call in 1991 was made on a Nokia phone and a Nokia network
  2. The first mass-market smartphone, the Communicator in 1998
  3. First compact smartphone, the 7650 in 2002.

While these innovations and “firsts” happened many years ago, Nokia’s ability to innovate is just as important at the low end. Nokia was the first company to address the lowest tiers of the market with over a billion customers served. This was no small feat and many observers faulted the strategy when it began in the middle of the decade.

I would not discount the difficulty and determination required in reaching those customers. Engineering a profitable low end product is as hard if not harder than engineering a high end superphone. More importantly, you have to find a way to distribute to these hard-to-reach customers and find ways to make the product useful, usable and affordable. Were it not for these efforts, the company would be facing collapse today, similar to the fate of Motorola or Ericsson: squeezed in the mid-range.

Blaming “culture” is nothing more than suggesting bad management. The culture of Nokia did not change between the few years when it was successful and the years when it was not.

The challenge Nokia faces is not complacency. It’s that the business model for selling voice-oriented phones is diametrically opposed to the business model for selling data-oriented phones. In one case you cooperate with and sustain operators, in the other you compete with and disrupt them.  It looks damn near impossible to do both with the same organization. Everything must be done differently. The real problem is that Nokia has not realized this and therefore can’t build its own replacement.

Apple's growth vs. top ten largest tech companies

In the last article I described growth vs. P/E and price change for the largest “ultra-large cap” companies, of which Apple features prominent.

In this article I take the same analysis to the top ten largest technology companies (by market cap, see table at bottom).

In this comparison, Apple no longer has the largest P/E ratio. Qualcomm, Google and Oracle are all at similar levels of valuation relative to earnings, however Apple’s growth outstrips them, only with Google in the same quadrant.

Note the “Wintel” cohort consisting of Intel, Microsoft, HP clustered around the Low growth, low valuation quadrant in the lower left (coincidentally co-located with IBM). Oracle, Qualcomm and Siemens show high valuation with low long-term EPS growth. Cisco is somewhat on the fence.

When comparing how the market has rewarded growth through share price appreciation, the correlation to growth is much better. Google seems under-rewarded.

Data follows:

Apple's growth vs. top 10 largest market caps

Apple’s stock price has been rising. Although it’s still priced at a P/E of 22 while facing near term EPS growth well above 50%, this is belated recognition of the potential of the iPad and the iPhone.

However, as it has grown, Apple’s valuation is now not only higher than any other technology company but it’s nearly the most valuable company on the planet. There is a theory that ultra-large market caps are reserved for companies that are past their prime. Sometimes this is attributed to the law of large numbers: that conclusion that big numbers cannot grow much bigger because compounding growth is exponential whereas markets are limited and become quickly saturated.

The trouble with this theory is that “large” is relative; large is often simply “the largest”. Large market caps are not what they used to be. During past booms, large caps touched a trillion dollars. Today, the largest market cap is merely $314 billion.

So I don’t put much faith in large number “laws”. The real question of under/over-valuation rests on whether the company is growing or not. Valuation is simply the net present value of future free cash flows (plus assets). So the most important determinant of current value is growth in cash flows.

It’s fairly easy to assess this: compare P/E which is a proxy for valuation with EPS growth. The following chart does this for the top ten largest market caps traded on US exchanges (as listed by finance.google.com).

One should see some correlation between the two variables, but given the 5 year time frame, many of these companies showed large volatility. There are outliers like HSBC which has a rapidly rising value even though it was badly affected by the credit crunch.

The other outlier is Apple. The company showed 93 percent EPS growth over a five year period and has a P/E of 22. The company with the next highest total value (Exxon Mobil) had 0.5% growth with a P/E of 12. The company with the next lowest total value (Microsoft) had 13.3 percent growth with a P/E of 12.

For an ultra-large cap, Apple’s growth is unprecedented and extraordinary. It’s in fact off the scale. The average growth of the other 9 top caps is 3.6 percent!

Apple’s growth is a factor of 25x higher. The P/E is only 1.6x higher.

The result has been a much higher appreciation in the stock price as shown in the following chart.

So it’s clear that Apple, in this peer group, is far from ordinary.

Data follows:

Asymco

Asymmetric Competition

Skip to content ↓