Why OPK was fired

Under Kallasvuo Nokia embarked on the most dramatic shift in its business since entering the mobile phone business in the early 90s.

The shift was not into mobile software which began in 2001 under his predecessor. It was not into enterprise solutions which also preceded his tenure. OPK’s main contribution was the move into mobile services.

The concept of mobile services may be an unfamiliar one for casual observers because it has not become a visible business for operators and certainly not for handset vendors. It’s also a complicated business model that requires some deeper understanding of the way the telecom industry is structured.

What Nokia had in mind was to offer various value-added, billable services to operators which would be enabled by Nokia handsets. The types of services included music subscriptions (Comes With Music), email (several acquisitions), photo sharing, and navigation.

The idea was that since many operators would not be capable of rolling out own brand services and could not do the heavy back-end lifting or the integration with handsets, someone could step in and roll out white labeled solutions world-wide. Third parties would also find it impossible to integrate and would lack the relationships Nokia had with operators world-wide.

For example, Nokia could enable a South American operator to offer email services to all their customers (with or without smartphones) and that service could be offered at a certain incremental price over the basic voice plan. The client implementation could be device independent but Nokia devices would probably work better. This would lead to higher ARPU which could be shared with Nokia.

Anyone can see that this is a complicated business plan and is therefore unlikely to be successful. But what makes it a complete failure is the realization that most buyers will resist the idea of paying for individual services separately. $1/mo for email, $2/mo for music, $3/mo for maps, etc. is repulsive. Users stampeded instead to unlimited data plans and smartphones which offered all these services and hundreds more for free or at prices negotiated with third party providers, rather than the untrusted network operators.

And therein lies the entire cause of Nokia’s strategic failure: an operator centric point of view. It led to poisoned devices and irrational business plans.

Which leads to the question in the headline. Is this mistake recognized and is it big enough to cause such a disruptive CEO dismissal?

I argue yes. Strategic errors are forgivable, but the they become a capital offense when they turn into a derailment of the core business. Instead of being enhanced with value-added services, the core business collapsed under the disruptive attack of unlimited data.

But it gets worse. Like the capital offense that Robbie Bach was guilty of at Microsoft, there has to be some direct accountability. To add insult to injury, OPK single-handedly pushed through the biggest and stupidest acquisition in Nokia’s history. To support this flawed vision of mobile services OPK bought Navteq for $8.1 billion in October 2007.

Intended as a service that could be rolled out on all phones and monetized through operator billing, Nokia maps is a free service that will never return anything to shareholders.

Missing where the puck was going is one thing but burning precious capital is another. This, in my humble opinion, is why OPK was fired.

Speaking of pucks, here’s hoping fresh Canadian eyes will see where it’s going.

Android is in 60 devices, in 49 countries, 59 operators and 21 OEMs

@tim Google often finds out about new Android phones the same day the rest of the world does. The joys of an open platform!

via (1) Twitter / Home.

Clears up why they rely on “activations” to find out what’s going on in the market.

Android is open unless you want to change your search engine to Google, or use tethering or Google maps or non-market apps

That means no seamless integration with Gmail. No Google Latitude. No multitouch in the map app, either. And in place of the free and fantastic turn-by-turn Google Navigator app, Verizon installed its VZ Navigator service — a feature which costs $10 a month to use.

It would be one thing for Verizon to set the default search and map app to Bing with the option to switch back to Google. But it’s utterly inexcusable for Verizon to destroy the possibility of a switch without the user having to root the device and, under Verizon’s company policies, void their warranty. And on top of that, repeatedly charge you for a sub-par service instead of keeping the gold standard of navigation apps for free.

And as bad as that is, there’s now a rumor that Verizon will be doing this again. On every single one of its Android devices.

After speaking with a Verizon representative about the Bing debacle on the Fascinate — who also lied about the existence of a search alternative — The Droid Guy contacted two Verizon tipsters who told him that the carrier “is dropping the Google Search from all future Android Devices and offering Bing in it’s [sic] place.”

via Verizon Rumored To Replace Google With Bing On All Android Devices | Markets | Minyanville.com.

Lots more in the linked article.

This story just keeps getting better and better.

Regardless of motivations, the restriction if broadly applied would have Verizon reneging on its pledge to support the openness of Android and reflects a wider trend of the OS being artificially restricted by carriers. Most US providers are disabling Android 2.2’s tethering support in favor of their own, and AT&T has banned non-Market Android apps under the pretext of security. The moves paradoxically leave Apple’s iPhone more open in some areas, as its users can choose Google, Bing or Yahoo for search and don’t have first-party apps deliberately hidden or broken.

Read more: Electronista

It takes nearly $1 billion/yr to run iTunes

In recent articles I highlighted the acceleration in iTunes App downloads where the rate is approaching 18 million apps per day and the cumulative total apps which is about to overtake the cumulative songs downloaded.

We now turn our attention now to constructing the iTunes income statement: namely total sales, gross margins and deduce its operating budget.

Gross Sales

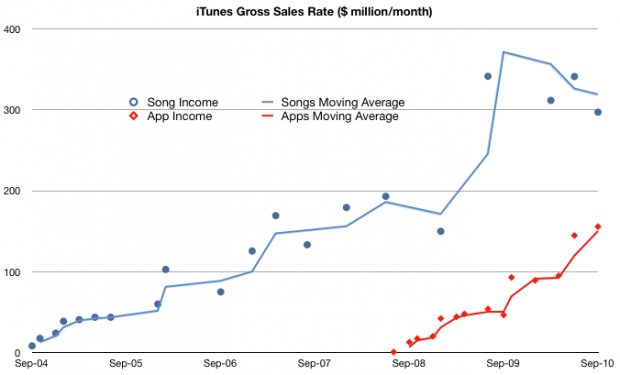
To obtain the top line (income) for iTunes we need to know the average selling price (ASP) for songs and for apps. Apps are easy, we received that info in June: $0.29 per app. For songs, it was easy before early last year: $0.99/song. After the selective price increase, the blended price needs to be estimated. I chose $1.10 for 2009 and $1.2 for 2010. These are just assumptions and can be adjusted but should give us a rough estimate:

I followed the convention of using income rate or $/month to show the history of sales. It shows that even with a price less than a third of the music product, apps are generating over half of the sales of music. In other words, apps are adding 50% to iTunes sales today. If the decline in music units continues and the app sales increase with the current trajectory then app sales value will overtake music sales next year, consistent with the cross-over of cumulative units sold.

Gross Margin

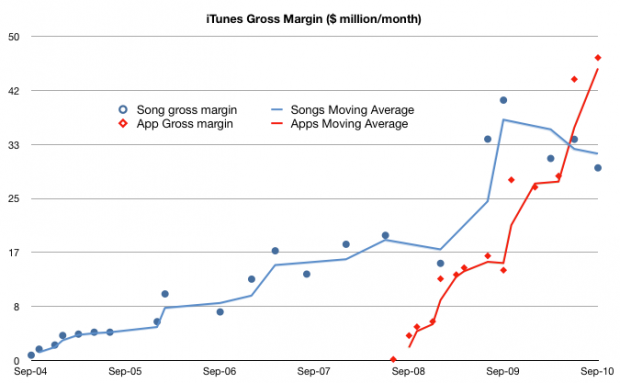
If we know how much Apple pays music licensors and developers (i.e. cost of goods sold) we can calculate how much it keeps for operations (gross margin). Apple’s app margin is 30 percent. The music margin was never official but the consensus has been 10 percent for a while.

Using these figures, we get the following chart:

This shows that what is left after paying the content license, Apple “keeps” about $50 million every month to run the App store (iTAS) and another $30 million to run the Music store (iTMS).

The Operating Budget

Apple has made a point of saying that both iTAS and iTMS are run at “break even” implying that the gross margin is used up in operating costs (CAPEX, R&D, SG&A). To be sure, the cost of bandwidth and the data center(s) needed must be considerable.

But the operating budget for the store is beginning to reach a level that may be beyond what can be spent reasonably. The amount left over for operations has increased from ~$30 million a month in 2009 to $75 million/month today.

In fact, if this burn rate is maintained (even though it’s increasing) the operating budget for iTunes is nearing $1 billion/yr.

I’m not an expert on the cost of operating data centers but $ 1billion a year seems like a lot. I would love to see an analysis of how this could be allocated.

Implications

I would also add that because of the increasing mix of apps, the overall gross margin percent is increasing. I estimate that to be a blended 17%–a healthy margin for a content store–and an increase from 10% before the app store came online.

Finally, one implication of the economics involved is that a budget like this may provide a significant barrier to entry for any competitors looking to take on the iTunes juggernaut. iTunes has reached content critical mass (12 million songs), user base (160 million users) and wide distribution (23 countries for songs and 80+ countries for apps).

These are non-trivial operational issues that even the best in the “cloud” business models will find challenging.

Footnote:

This discussion excludes video sales, rentals, book sales as we don’t have solid histories for these product lines. However, we can do a spot check on the cumulative totals:

  • 450 million TV episodes downloaded implies $1 billion in sales.
  • 100 million movies downloaded probably adds at least another $1 billion
  • 35 million books adds another 500 million.
  • Compare with 11.7 billion songs at ASP of $1 for about $12 billion in song sales and 6.5 billion apps at ASP of $0.29 or about $1.9 billion.

iTMS content downloads have generated $16.4 billion in sales to date.

iTunes app total downloads to overtake songs this year

Last week I posted the iTunes download rate graph that showed how Apps are being downloaded much more rapidly than songs and revealed an inflection point in the song rate.

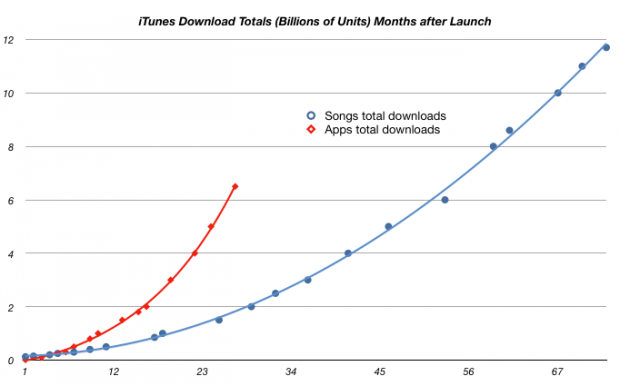
Based on the recent updates to iTMS and iTAS on Sept. 1, the following graph shows the cumulative units of songs and apps downloaded indexed to the same starting date.

As can be seen, the App store has reached the same total downloads in 2.2 years as the iTMS reached after five years. The two curves are likely to be the same height (around 13 billion each) before the year is over.

Google vs. Android Part IV

Verizon, unfortunately, is also what ruins the phone. Or, rather, what it’s forced Samsung to do to the phone, which you could sum up in a word: Bing. Bing is the default—and only—search engine on the Fascinate. A Google Android phone. In the search widget, in the browser, when you press the search button. Bing. No, you can’t change it. There’s no setting for it, and the Google Search widget that you can snag from the Market is blocked (or at least very carefully hidden). Being unwittingly forced into Verizon and Bing’s conjugal relationship is infuriating on its own, but the implementation also feels like the sloppy hack that it is.

via Daring Fireball Linked List: Matt Buchanan on Verizon’s Samsung Fascinate Lightning.

John Gruber astutely adds:

Android is “open”, but who it’s open for, primarily, are the carriers. (Somehow I doubt we’ll see any Windows Phone 7 devices where Google is the one and only search option.)

The primary defense of Google’s Android strategy is that it’s beneficial in driving traffic to Google’s services/properties. This is by no means a certainty. To the contrary, it seems likely that the Android experience will be defined by operator back-room deals.

See also: asymco | Android vs. Google Part II

Coupling a lack of control over the platform, the revenue streams, the user experience, the potential banishment of AdMob from iOS and an attack on Google’s brand, Android is currently winning the war with Google.

However, my money long term remains with Google. They can and will eventually beat Android. Perhaps with Chrome.

[Footnote: if anyone wonders why Verizon, Google’s best friend in mobile, is gutting Android, you need to remember an exclusive five-year deal Microsoft struck with the carrier to provide search and advertising services on the phone. Microsoft was rumored to pay $500 million for the opportunity.]

Smartphone market growing faster than expected

IDC raised its 2010 smartphone sales growth forecast to 55 percent from 44 percent earlier. Citing booming smartphone demand it also lifted its forecast for overall cellphone market growth to 14.1 percent from 12.6 percent.

via Cellphone market growing faster than expected -IDC | Reuters.

Keep in mind the 55% growth figure when reviewing analyst forecasts for iPhone growth. If their forecast is less than that then it implies market share loss. When I suggested 50% compounded annual growth rate (CAGR) for iPhone going forward 3 years, there was a lot of skepticism but this market is growing faster than most people expected.

I still believe that Apple can grow the iPhone at least as fast as the market.

Here are the quarterly y/y growth rates for iPhone units since sales began:

159% 516% 88% 90% 644% 7% 100% 131% 61%

On a yearly basis:

2007: 3.7 million

2008: 13.7

2009: 25.1

2010 first half: 17.15

2010 (my estimate): 44.4

Will Apple need to cut margins on the iPhone?

Many comments on and off this blog raise the specter of the inevitable decline in Apple’s margins due to two forces:

  1. The iPhone begins to reach into more markets or points of distribution without exclusivity.
  2. The Android surge will apply competitive pressure forcing Apple’s pricing and hence margins.

The first claim can be countered by observing that Apple has not cut margins when switching from exclusive to non-exclusive distribution in several markets. In fact, Apple made this information public: When Tim Cook was asked in October 2009 earnings concall “So when you go from exclusive to multiple, you don’t change the charge to the carrier?” Cook answered, “Correct.”

The second claim can be countered by observing that innovation trumps pricing every time. When looking back at the three years’ history of the industry there is a clear but counter-intuitive demonstration of the power of innovation in the market.

Whereas one would expect that in a highly competitive market torrid growth would only be possible with lower pricing and hence margins, the opposite is observed in the phone market during the last three years:

[HTC data is over a two year period]

The graph shows that companies that grew the fastest had the highest margins, and the companies that grew the slowest had the lowest margins. The trend line in the graph above is precisely orthogonal to what would be expected in a commodity market.

The orthogonality of growth vs. margin points to the effect of innovation in this market. In a non-commoditized market (i.e. one where usable improvements in a product are quickly absorbed and highly valued) high growth and high margins are correlated.

In a commodity market (i.e. one where improvements in a product are neither absorbed nor valued) growth can only come at the expense of margins.

Being able to spot when a market tips from innovation-driven disruption to price-driven commodity sales is an essential skill for both investors and managers. It requires a comprehensive and integrated analysis of technology, finance, consumer behavior, competitive forces and a lot of faith in theory to make the right call.

As a keen observer I think the market still has a long way to go before it reaches this tipping point. I don’t see it happening in the next three years (which is just 2 product cycles–the most an outside observer can hope to roadmap).

Nokia's fifth last chance

The cellphone maker will unveil its new flagship model E7, which comes with a large touchscreen and full keyboard, at the show in London, two sources with direct knowledge of Nokia’s plans told Reuters.

via PREVIEW-Nokia bets on new smartphones for recovery | Reuters.

Analysts have been saying that Nokia has one last chance to fix (software, UI, strategy, etc.) for some time now.

Nokia sold 24 million smartphone units sold in Q2 which represented significant growth. Sales and Profits however were both down but to say that Nokia is facing imminent demise is misguided.

How is Nokia able to sell so many units when its portfolio elicits so much pathos?

The reason Nokia can still coast with poor products is that they have a vast distribution network. I don’t know the exact distribution but let’s assume that half their phones go through carriers and half through distributors who resell unlocked phones world-wide. Carriers will continue to carry the phones because they slot into well-established portfolio slots and distributors will continue to distribute because the product is competitive in markets where there are no other unlocked smartphones at the same price.

So predicting imminent failure without taking into account distribution inertia is showing a lack of understanding of the market. The same insensitivity to distribution is why so many predictions of Microsoft’s “death” or RIM’s “death” fail.

The less sensational but more accurate description of Nokia’s predicament is that their strength in distribution prevents them from reforming their business model in order to benefit from the disruption that mobile broadband is bringing to mobile telecommunications.

That’s a mouthful.

iOS users downloading 17.6 million apps/day. Songs, not so much.

Thirty days after the launch of the iTunes App Store, Apple announced that 60 million apps were downloaded in the first month of operations generating sales of $30 million. “This thing’s going to crest a half a billion, soon,” Jobs said adding that it may be a “$1 billion marketplace at some point in time.”

Mr. Jobs was being modest.

To see how modest we have the following data:

If the current download rate is maintained (17 million apps/day) and if the pricing of $0.29/app is preserved, then $1.8 billion will have been spent on iOS apps this year.

With the rate of downloads increasing as steeply as it is, $2 billion in sales is not unlikely in the third year of the store. Twice what Jobs was predicting for “some point in time”.

The other line in the graph is the iTunes music download rate. I’ve written about it before and pointed out that the point of inflection in the download rate coincided with the increase in price for songs from $0.99 to $1.29. Not much more to say here except that the trend continues and music downloads continue to slow.

As far as Apple is concerned, the slowdown in iTMS is more than offset by the increase in iTAS. As far as the music industry is concerned, I don’t think CD sales are increasing. Does anyone know?

Asymco

Asymmetric Competition

Skip to content ↓