Illiteracy is the inability to read and write. Though the percent of sufferers has halved in the last 35 years, currently 15% of the world has this affliction. Innumeracy is the inability to apply simple numerical concepts. The rate of innumeracy is unknown but chances are that it affects over 50% of us. This tragedy impedes our ability to have a discourse on matters related to quantitative judgement while policy decisions increasingly depend on this judgement.
But there is another form of ignorance which seems to be universal: the inability to understand the concept and role of innovation. The way this is exhibited is in the misuse of the term and the inability to discern the difference between novelty, creation, invention and innovation. The result is a failure to understand the causes of success and failure in business and hence the conditions that lead to economic growth.
My contribution to solving this problem is to coin a word: I define innoveracy as the inability to understand creativity and the role it plays in society. Hopefully identifying individual innoveracy will draw attention to the problem enough to help solve it.
One example is in the following quote:
“Lastly, nationally circulating tabloid Ilta-Sanomat gets a look at Nokia’s fabled tablet computer that was developed nine years before the iPad hit the market. According to the paper, Nokia had its own innovative tablet device ready in 2001, but unfortunately it never made it to the shops. A former Nokia expert Esko Yliruusi says that the project was suspended a heartbeat before the tablet hit the market because it was thought that there was insufficient demand for such a device.”
To explain what’s wrong with this usage we need some definitions.
The definition of innovation is easy to find but it’s one thing to read the definition and another to understand its meaning. Rather than defining it again, I propose using a simple taxonomy of related activities that put it in context.
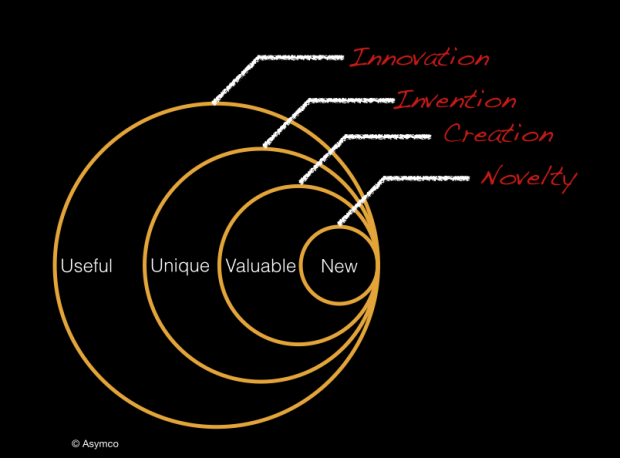
- Novelty: Something new
- Creation: Something new and valuable
- Invention: Something new, having potential value through utility
- Innovation: Something new and uniquely useful
The taxonomy is illustrated with the following diagram. The position of the circles shows the embedding of meaning
To illustrate further, here are some examples of the concepts.
- Novelties: The choice of Gold as a color for the iPhone; the naming of a version of Android as “Kit Kat”; coining a new word.
- Creations: The fall collection of a fashion designer; a new movie; a blog post.
- Inventions: Anything described by a patent; The secret formula for Coca Cola.
- Innovations: The iPhone pricing model; Google’s revenue model; The Ford production system; Wal-Mart’s store design; Amazon’s logistics.
The differences are also evident in the mechanisms that exist to protect the works:
- Novelties are usually not protectable but since their value is very limited the copying is not seen to cause harm.
- Creations are protected by copyright or trademark but are not patentable since they lack utility.
- Inventions can be protected for a limited time through patents but can also be protected indefinitely by being kept secret. Their uniqueness may also be the means by which they can be kept a secret.
- Innovations can be protected through market competition but are not defensible through legal means.
Note that the taxonomy has a hierarchy. Creations are novel, inventions are creations and innovations are usually based on some invention. However inventions are not innovations and neither are creations or novelties. Innovations are therefore the most demanding works because they require all the conditions in the hierarchy. Innovations implicitly require defensibility through a unique “operating model”. Put another way, they remain unique because few others can copy them.
To be innovative is very difficult, but because of the difficulty, being innovative is usually well rewarded. Indeed, it might be easier to identify innovations simply by their rewards. It’s almost a certainty that any great business is predicated on an innovation and that the lack of a reward in business means that some aspect of the conditions of innovation were not met.
The causal, if-and-only-if connection with reward is what should be the innovation litmus test. If something fails to change the world (and hence is unrewarded) you can be pretty sure it was not innovative enough.
Which brings us to the quote above. The fact that the Nokia tablet of 2001 not only did not succeed in the market but was not even released implies that it could not have been innovative. The product was only at the stage of perhaps being an invention (if it can be shown to be unique) or merely a creation (if it isn’t.) Furthermore, if the product is so poorly designed that it is literally unusable then it is just a novelty. A design, sketch or verbal description might be novel but it does not qualify as an innovation or an invention or even a creation. How far the depiction went toward making a dent in the universe defines its innovativeness.
Why does this matter?
Understanding that innovation requires passing a market test and that passing that test is immensely rewarding both for the creator and for society at large means that we can focus on how to make it happen. Obsessing over the mere novelties or inventions means we allocate resources which markets won’t reward. Misusing the term and confusing it with activities that don’t create value takes our eye off the causes and moves us away from finding ways of repeatably succeeding.
Recognizing that innoveracy is a problem allows us to address it. Addressing it would mean we could speak a language of value creation that everyone understands.
Wouldn’t that be novel?