
Horace reflects on his analysis of iTunes purchase data, details the just-announced AirShow in Chicago, and touches on fascinating “heat maps” of mobile platform use. We close our week of three shows by talking about “deep focus” and Citizen Kane.
Measuring the iTunes video store
It’s been five years since we had an update on TV show downloads and six years since we’ve had an update on movie downloads from Apple. In Q3 2008 Apple announced 200 million TV show downloads and in Q2 2007 2 million movies. That’s a long period with no information making a tough extrapolation to the present.
Nevertheless, I tried. My estimates for these two quantities were 963 million TV Shows and 108.2 million movies to date.
So I was quite surprised to see that figures for both TV show downloads and Movie downloads were published today. The figures were 1 billion and 380 million respectively.
My TV show forecast has proven to be very accurate but I severely underestimated movie download rates. Apple states that the movie download rate is 350k/day. My estimate was only about 126k/day.
After adjusting for the new data, the picture of downloads that emerges looks like this:
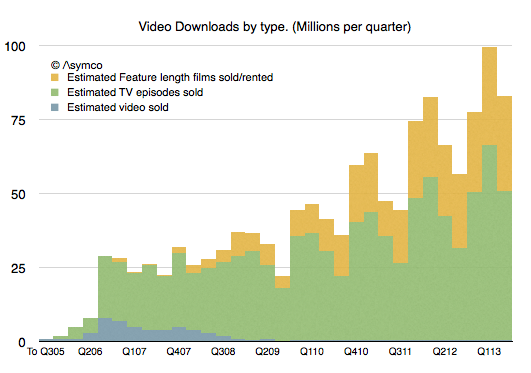
The overall iTunes gross revenues by sub-component becomes: Continue reading “Measuring the iTunes video store”
Next Airshow: Chicago, July 13th

We’re excited to bring the second Airshow to Chicago in July. Thanks to Ryan Singer and Jason Fried of 37signals.com for offering to host us this summer. Their venue is ideal for our particular pedagogy.
Speaking of which, I should explain what it is.
Our first Airshow (San Francisco, June 9th) had several objectives:
- To explain a theory of narration with data, especially big data
- To narrate this explanation with a tool called Perspective
- To reveal and test a new feature within Perspective called airshow
Now that we have revealed the feature (mirror your presentation including your direct manipulation of the visuals to any member of the audience—wherever they may be—on their own device, available in version 3.0) we can talk more freely about the structure of the show.
It’s in three parts:
- Performance
- Cooking Show
- Theory
The Performance is the “keynote story” whose recipe we show in the Cooking Show and whose motivation and foundations we deconstruct in the Theory. You can think of the sections as as answering “{What, How and Why} make a great story.”
The show is self-referential in that we use the process we teach to do the teaching. In other words, we use a great storytelling tool to tell great stories about storytelling. Furthermore, Airshow, as a show, uses a tool whose feature is itself called airshow.
It’s not that complicated; at least not if you understand recursion.
Register here: airshow.asymco.com (Limited to 37, bring an iPad).
The Critical Path #88: Siri in the Driver's Seat
In the second part of our WWDC wrapup, we delve into the large-scale shift represented by iOS 7. Siri guides us on the journey from navigation to consumption in our latest AsymCar segment, and Horace examines what iWork for iCloud means.
via 5by5 | The Critical Path #88: Siri in the Driver’s Seat.
The Critical Path #87: De Gustibus
In the first part of a post-WWDC “doubleheader”, we look back at AirShow and begin our dive into the keynote, with regard to Apples hardcore product Mac Pro, Mavericks, iTunes Radio, and examining discovery versus playback.
What's an Apple user worth?
This week Apple announced that iTunes has 575 million accounts. This is the 8th update (that I know of) over the last four years. The history of this data is shown in the following graph.
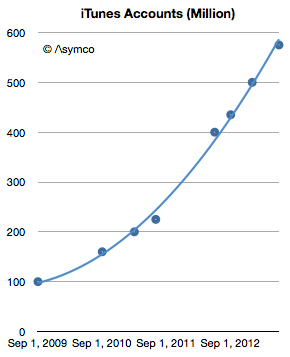
The number of accounts has increased by almost a factor of six since late 2009. It amounts to an account growth rate of about 500,000/day or 44% compounded annually. Not bad, but along with this increase what happened to revenues per user? Continue reading “What's an Apple user worth?”
Measuring the latest iOS accessory market
One of the most startling announcements during the WWDC 2013 was iOS in the car. The mockup that was shown seems to indicate the use of the car’s in-dash display as an “external monitor” for an iOS device while control would come from inputs using Siri.
The technical details were not released so it’s hard to know the protocol used to accommodate this interface. However it seems that it will be generic enough that a number of launch brands signed up for the launch. The list includes Honda, Mercedes-Benz, Nissan, Ferrari, Chevy, Infiniti, Kia, Hyundai, Volvo, Acura, Opel and Jaguar.
Is this a significant opportunity?
Before we get excited, it’s important to note that this will likely take a very long time. It won’t even begin until 2014 and the number of new models may trickle into showrooms quite slowly. Consider that the time it took for automakers to universally support external audio input (mostly the trivial line-in) was about a decade.
To also curb our enthusiasm we need to realize that the car industry does not produce many units. In 2012 there were over 60 million cars produced (with the following regional mix:)
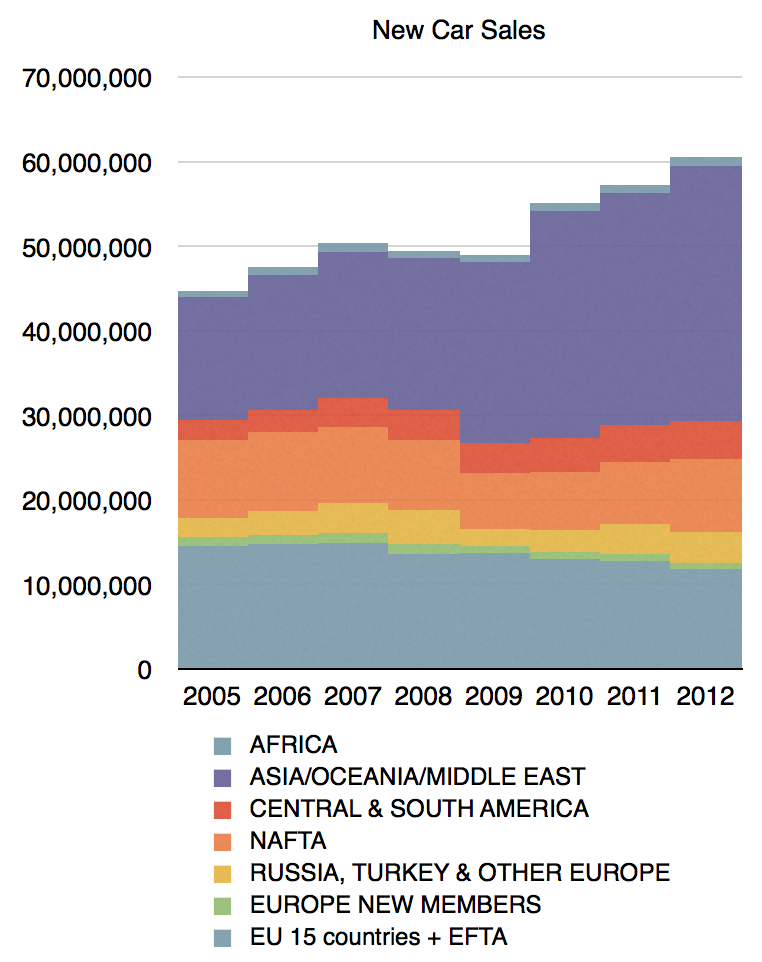
In contrast, 60 million is about the number of phones sold every two weeks. In 2013 there will be more iPads sold than cars.
In particular the companies mentioned had the following production figures in 2011: Continue reading “Measuring the latest iOS accessory market”
Measuring US Mobile Platform Shares: Kantar vs. comScore
The latest comScore US smartphone install base data is in and there are few surprises. iPhone has reached a new record high penetration (39.2%) and user base (54.3 million). Android has reached a new high in user base (72 million) but share at 52% is below the peak reached in November 2012.
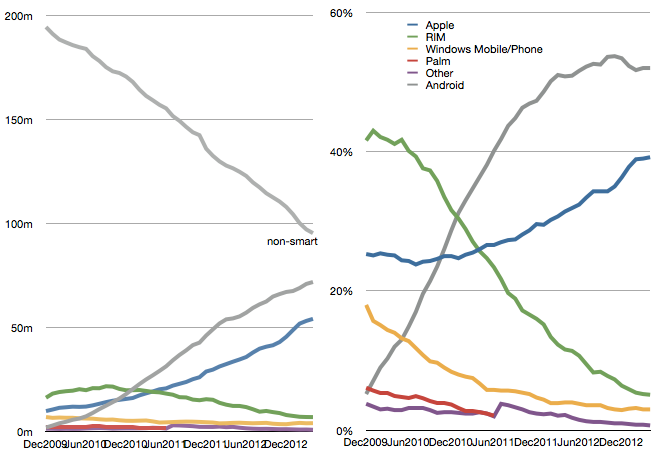
This pattern of gradual iPhone share gain in the US has been consistent for over two years even while Android has catapulted into an overall lead. The surprising thing is how Android seems to have peaked in share. There are still 95 million non-smartphone users and there seems to be headroom for growth even though the other platforms have been tapped out. But it does not seem that Android phones have any particular advantage over iPhone. My hypothesis remains that as price is taken out as a differentiation, the adoption of iOS is slightly higher than Android.
Another measure of market performance is the implied net platform user gains which is shown below: Continue reading “Measuring US Mobile Platform Shares: Kantar vs. comScore”
Forecasting Windows market share
Last week Frank X. Shaw, VP of corporate communications at Microsoft stated:
… most of the people around me were using their iPads exactly as they would a laptop – physical keyboard attached, typing away, connected to a network of some kind, creating a document or tweet or blog or article. In that context, it’s hard to distinguish between a tablet and a notebook or laptop. The form factors are different, but let’s be clear, each is a PC.
Actually this “admission” that iPads are PCs is not something new. Steve Ballmer made the same assertion in 2010 pre-iPad (though calling them slates). Arguably, the notion that tablets are PCs has been dogma at Microsoft for over a decade and Windows running on all form factors has been a strategic guiding principle.
Which is why I’ve always added the tablet data to the PC data to create a picture of the “personal computing” market. And this is what that picture looks like today:
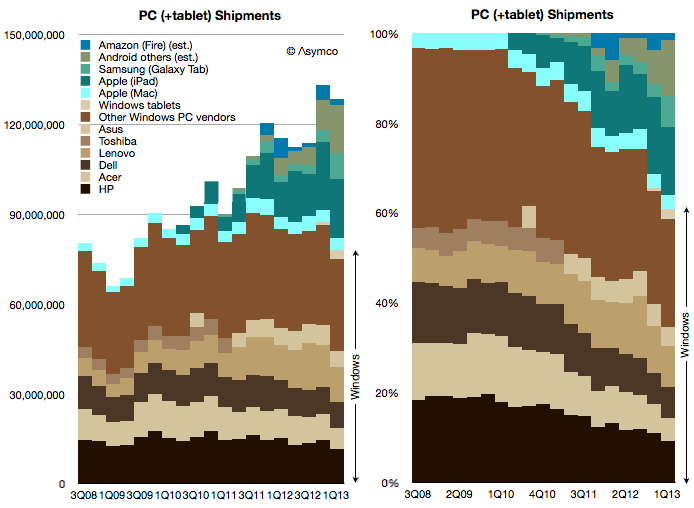
Note how the share of various platforms has evolved over this brief time span: Continue reading “Forecasting Windows market share”
100 billion App downloads
By the end of May there will be 100 billion mobile apps installed on iOS and Android devices.
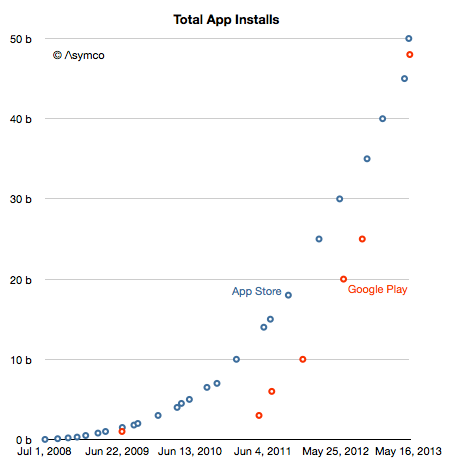
Not bad for a five year old medium.
With respect to attach rate, the total downloads/install base are currently 83 apps per iOS device sold and 53 apps per Android device activation. The history of this is shown below: Continue reading “100 billion App downloads”