For more analysis of Apple & the industry, join us at ACTIVE 2025.

Measuring iOS as a gaming platform

At this year’s WWDC Apple offered an update on Game Center accounts. The data we have so far is shown in the following graph.

Before being acquired, another network, OpenFeint, announced 180 million iOS accounts in October 2011. Another figure to consider is the 40 million subscribers to Xbox Live (out of 66 million Xbox users). This subscriber base is paying for a service (about $1 billion per year) so it’s not the same as the free Game Center model.

Rather than being a revenue source, Game Center is designed to engage users and to capture usage information. It also lets us gauge gaming “consumption” on iOS devices. That itself allows us to contemplate it as a gaming platform vis-à-vis alternate platforms.

To consider the figure as a proxy of penetration and engagement, the graphic below shows cumulative sales of gaming devices.[1] Continue reading “Measuring iOS as a gaming platform”

How many iPhone “5''s will be sold?

Phil Schiller stated (under oath) that when assessing sales for a new model of the iPhone, Apple used an easy shorthand:

Each new generation sold approximately equal to all previous generations combined.

That’s a helpful gauge. Did it hold and will it continue to hold?

In order to test this rule of thumb we need to know generational sales. Although we know overall unit sales for a given quarter, since Apple has been selling several versions simultaneously, we need to make some guesses about the ratio of generations in the mix. My guess is about 10% for 3G vs. 90% 3GS and 5% 3GS vs. 10% 4 vs. 85% 4S. That results in the following pattern:

The cumulative totals for these generations can then be generated and they appear as follows: Continue reading “How many iPhone “5''s will be sold?”

The biggest loser

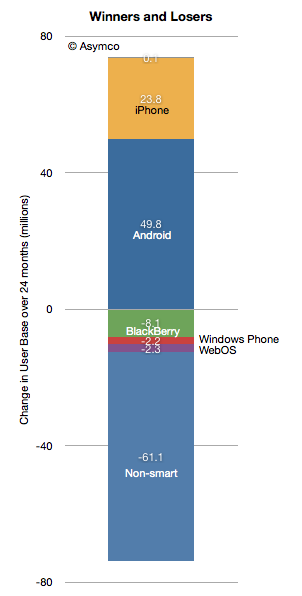
According to data from comScore, in the past 24 months 50 million Americans became Android phone users. In the same time frame Apple added 24 million iPhone users. As I mentioned in my Asymmetric Competition post, it would be unwise to consider this data in isolation. Consider the following graph showing the net change in users in the US.

Android and iPhone grew mostly at the expense of non-smart users. The BlackBerry lost 8.1 million users and all the others only lost about 4.5 million.

With penetration at 50% it’s still impressive that there is so little “churn” between platforms. In fact, measuring churn as the net platform user loss as a percent of all smartphone users, we get something less than 1% per month.

The smartphone competition is still primarily with non-consumption.

That will change at some point when smartphone penetration (shown below) will begin to saturate. Continue reading “The biggest loser”

Perspective and Context in Personal Computing

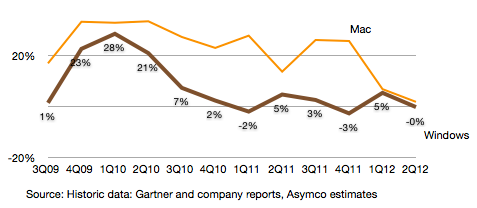
The Mac grew at the extremely low rate of 1.8% over last year’s second quarter. Although it grew faster than the Windows PC market, the gap has narrowed quite a bit. The following graph shows the growth of the two members of the computing Ancien Régime.

We have to wait a few more quarters before we can decide whether the Mac will enter a new phase of diminished expectations. Although it’s not immune from the impact of the iPad, the effect can take a long time to be evident and in either case, growth can come from conversion of Windows users which vastly outnumber loyal Mac users who might upgrade.

If we see the computing market as the superset of keyboard+mouse input and touch-based input then new computing consumption becomes easier to spot: Continue reading “Perspective and Context in Personal Computing”

5by5 | The Critical Path #48: Asymmetric Competition

We turn our attention to the notion of competition. It’s a concept that has many contradictory connotations. What we anticipate as sporting or fair is never the way business or war is conducted. How should you think about this and why does it matter in every decision you make professionally and personally?

via 5by5 | The Critical Path #48: Asymmetric Competition.

Asymmetric Competition

Thanks to Angel Lamuno for sending me to a dry and boring lecture by Dr. Israel Kirzner from Feburary 1988. It got me thinking again about competition and how confusing it can be.

The lecture was in part about how the word “competition” is used by economists with directly opposing meaning from that of the layman and how that leads to confusion about the role of free markets.

I won’t dwell on that, but instead I want to explain how this word can also be contradictory in meaning when applied in everyday usage in business analysis. Nowhere is this more evident than when we argue whether Apple competes with X or Y or Z.

Does Apple compete with Android or Google or Samsung? How could Apple compete with Google and yet cause it to be the default search engine in Safari thus enriching their competitors? How could Apple compete with Samsung and yet select their semiconductors for the heart of its most important and profitable product? And how could the people across the table from Apple agree to terms on these deals while being sued by them?

Some have tried to characterize this situation as “coopetition” or the co-habitation of conflicting strategies for a balanced optimum. I find this characterization uncomfortable and unsatisfying. The balance sought will be very fragile and change daily and no optimization is practically possible. It seems contrived.

Rather, I think about these situations as examples of asymmetric competition. This is competition where companies are rivals but they have different definitions of the basis of competition. In a way, they are like gladiators who have weapons which cannot be brought to bear or wielded effectively to counter the opponent’s.

Consider the following question: does the iPhone compete with the Galaxy SIII? Continue reading “Asymmetric Competition”

Estimating third and fourth quarter iOS shipments

In the 2011 Annual Report(10K) published October 26th Apple states:

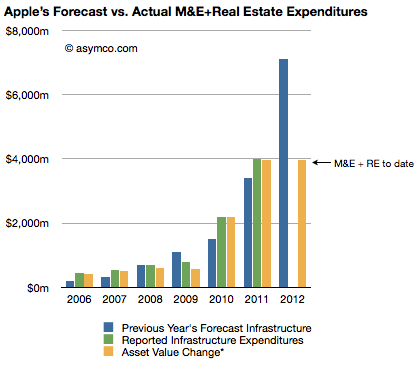
The Company anticipates utilizing approximately $8.0 billion for capital expenditures during 2012, including approximately $900 million for retail store facilities and approximately $7.1 billion for product tooling and manufacturing process equipment, and corporate facilities and infrastructure, including information systems hardware, software and enhancements.

The history of these expenditures is shown below (the blue bars are statements from 10K reports including the one above shown as the right-most bar): Three 10Q reports so far this fiscal year have given us updates on asset values and the change in these values are shown as the right-most yellow bar. The asset value change suggests $3.9 billion has been spent so far of the $7.1 billion budgeted. Thus we can estimate that about $3.2 billion remains to be spent in the fourth fiscal quarter (thus bringing the yellow bar to parity with the blue bar in the chart above–a parity that was achieved or exceeded for five out of the last six years).

Assuming $200 million of the fourth fiscal quarter budget will be for land and buildings[1] results in an estimated $3 billion remaining for product tooling and manufacturing process equipment and data centers.

The history of spending for various cost centers is shown below.[2]

Continue reading “Estimating third and fourth quarter iOS shipments”

Apple's growth scorecard for the third fiscal quarter 2012

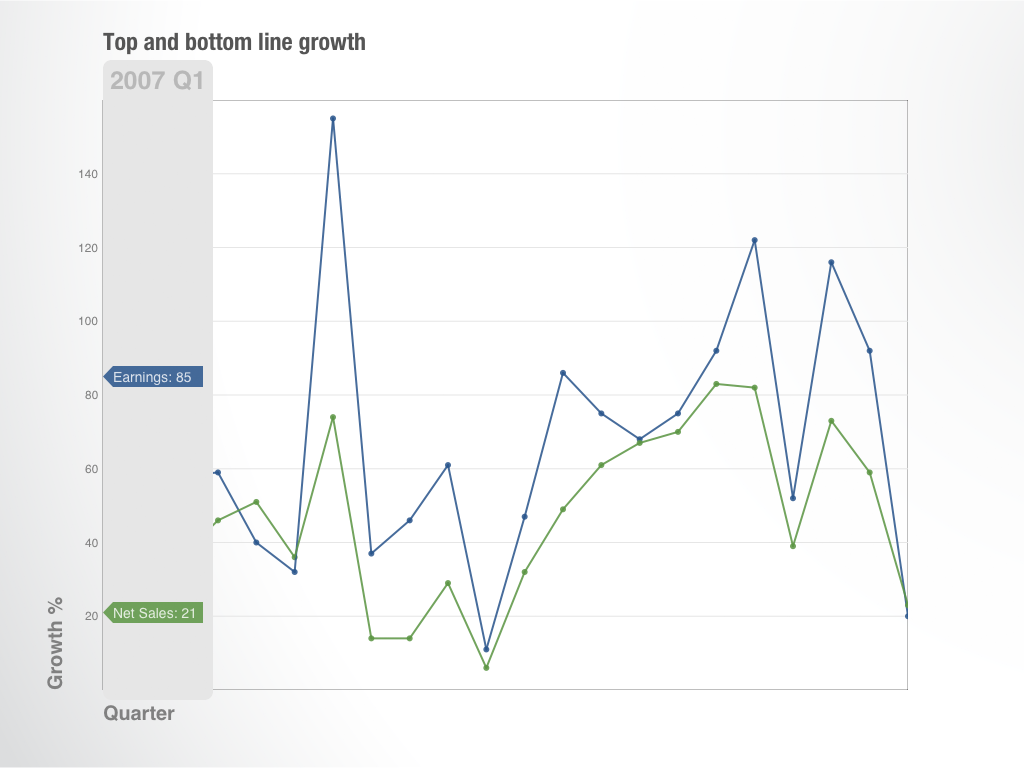
As the following revenue growth table shows, the second calendar quarter of 2012 was not like the recent past.

The bottom line growth (earnings) is the slowest since Q309 which had a difficult comparison with Q308 when the iPhone 3G launched and saw 800% iPhone growth. This past quarter also had a difficult comparison with 150% iPhone growth a year earlier and 122% earnings growth.

This is shown in a different way in the following graph: Continue reading “Apple's growth scorecard for the third fiscal quarter 2012”

Scoring my performance on the third fiscal quarter forecast

Did I get anything right in last forecast?

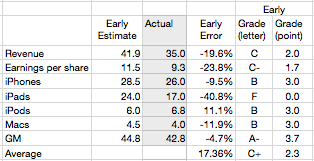
The table below shows the scores for my various estimates[1]

Last quarter I managed a B+ overall but this quarter was a C+. The iPad estimate was a complete failure mitigated slightly by a, directionally at least, correct call on the iPhone. The failure on iPad dragged down revenue and EPS while the accuracy on iPhone improved the gross margin. iPod and Mac estimates were consistent with recent performance.

The error on iPad is a harsh lesson which shows how the category is still unpredictable. With only four quarters where we could measure y/y growth, and with those quarters showing 183%, 166%, 111% and 151% growth, I assumed that the 150% growth was sustainable.

Continue reading “Scoring my performance on the third fiscal quarter forecast”

Padcast: Reviewing Apple's Third Fiscal Quarter 2012

Here is the second Perspective “padcast” where I discuss:

  1. Top and bottom line growth
  2. iPhone, iPad, iPod and Mac revenue growth
  3. iPad vs. Mac
  4. iOS product mix
  5. Other product line growth
  6. Gross Margins by product
  7. Pricing and revenue per unit by product
  8. Cash and cash growth
  9. Guidance and whether results were a surprise to management

The discussion is an audio presentation with animated, interactive motion charts which can be manipulated by the user.

It’s available as an in-app purchase for $0.99 on the iTunes app store via the Perspective iPad app.

Asymco

Asymmetric Competition

Skip to content ↓