For more analysis of Apple & the industry, join us at ACTIVE 2025.

The face and the brand

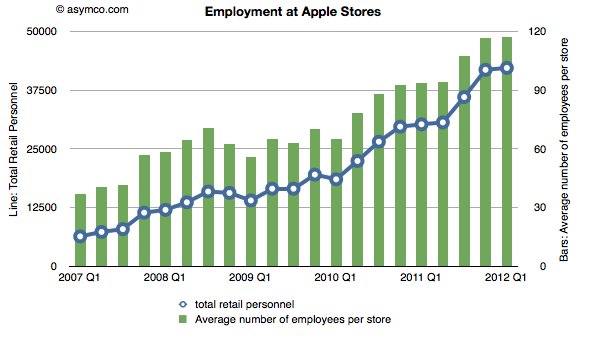
In the five years since the iPhone launched, Apple created a total of 35,852 retail jobs.

Some of those jobs came from new store openings. The total store count went from 172 to 361, more than doubling. But the growth in employment was faster: from about 6400 to 42,200, more than quintupling. This is reflected in the total number of employees per store which increased from 37 in Q1 2007 to 117 in Q1 2012.

Which brings up an obvious question:  Why did Apple triple employment at each store? Continue reading “The face and the brand”

MacDirectory: Exclusive | Apple's iOS Market Analysis

HD: Apps are like the sauce in a dish. They add flavor and distinguish the dish. Increasingly they also offer nourishment. Some would argue that we can live with plain cooking but spices drove people to do incredible things like risking life to discover new continents. Being the world’s best source for spices means the most innovative and brilliant minds will be attracted to innovate on top of Apple’s platforms.

Read more of the interview by Markin Abras here: MacDirectory: Exclusive | Apple’s iOS Market Analysis.

5by5 | The Critical Path #43: We'll take it from here

Horace and Dan look at Microsoft’s Surface through disruption colored lenses. First, the ongoing evolution of the computing value chain and how it foretold us of Surface. Second, how the economics of Microsoft’s businesses makes Surface compelling. We also begin a new segment tentatively called “Reader Questions”. This time it’s education: is it disruptable? If so how can we tell and where will it lead us?

via 5by5 | The Critical Path #43: We’ll take it from here.

Who will be Microsoft's Tim Cook?

As previously noted, Apple has overtaken Microsoft (and Google) in operating margin percentage. This is an astonishing statistic as Apple is still largely perceived to be a “hardware company” while Microsoft is a “software company” and Google is a “services company.”

To suggest that “hardware” could be more operationally profitable than either software or services is akin to heresy in technology analysis. This reversal is newsworthy indeed. However, even the most casual observer would note that Apple does not derive its market power from hardware alone. It is, in fact, an integrated hardware, software and services company (with a few more roles besides.)

So the emergent successful business architecture in this technologically transitional period is of integration and completeness of solutions.

This shift explains at least at a conceptual level Microsoft’s tectonic Surface shift.

But what about another point of view? What does integration mean for Microsoft’s income, cost and profit structure? Is integration self-disruptive to Microsoft?

Here’s a reminder of Microsoft’s revenues and operating income by division:
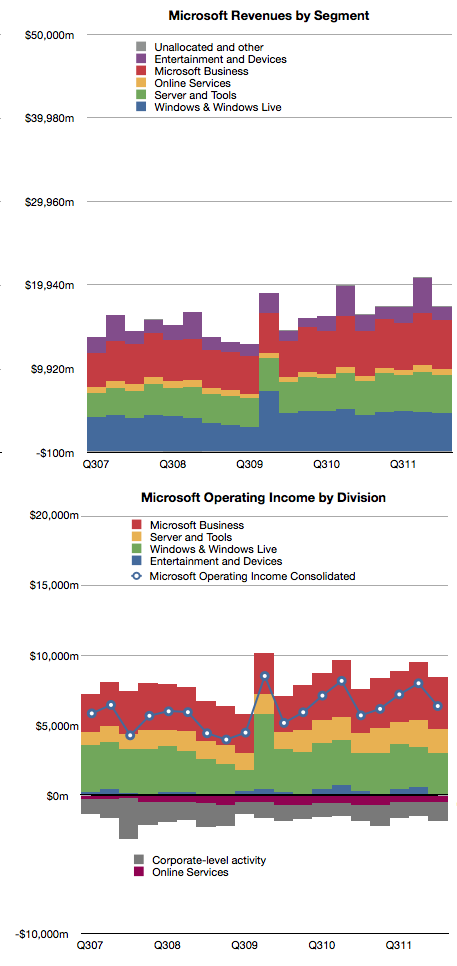
The challenge of devices for Microsoft is that the licensing of software for devices is very difficult to sell. Continue reading “Who will be Microsoft's Tim Cook?”

The evolution of the computing value chain

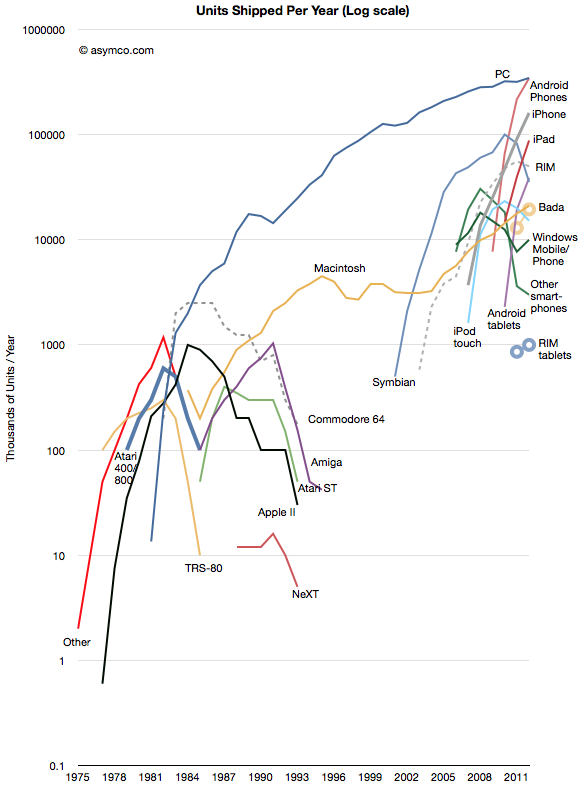
The history of personal computing has come to be defined as the history of Microsoft. At least since 1981 Microsoft’s operating systems have been the consistent market share leaders, and by a very large margin. That is about to change. This year Android will be on more devices sold than Windows. iOS is also set to also overtake Windows next year. The following chart illustrates the wave of mobile platforms that has emerged, and in spite of some notable failures, is overtaking traditional computing.

Of course we should remember that PC themselves overtook entrenched predecessors like minicomputers and mainframes which themselves overtook business computing systems based on adding machines, typewriters and slide rules. This is the cycle of disruption and there is nothing new about it.

However, it always seems to take people by surprise. Continue reading “The evolution of the computing value chain”

A more precise measure of Apple's device installed base (and device longevity)

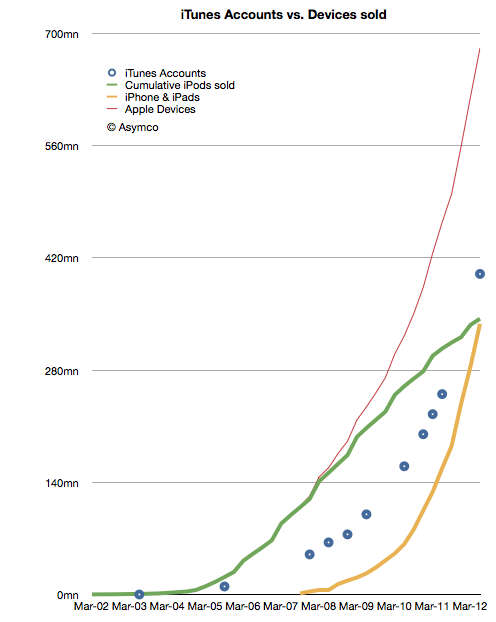
Apple announced that the total number of iTunes account (with credit cards attached) has reached 400 million. This was touted as being the largest collection of credit card accounts for any retailer and I have no reason to doubt it. However, looking beyond the bragging rights, there are more interesting patterns to observe about this asset.

What I plotted was the cumulative number of iPods sold (green), the cumulative number of iPhones and iPads (yellow), the combined devices total (red) and the reported number of iTunes accounts (blue). Continue reading “A more precise measure of Apple's device installed base (and device longevity)”

Update on Android growth

In February of this year MediaTek introduced an ARM chipset for Android smartphones targeting $160 end user pricing. I’ve heard estimates that this chipset will sell in the “hundreds of millions”.

The question is: are these units going to be “activated” as per Google’s definition of Android?

Historically, MediaTek’s chips have been used in “grey market” devices. These are typically copies of branded phones and are sometimes shipped without IMEI numbers and hence not even sanctioned by regulatory authorities. If hundreds of million of such Android devices are sold in the next few years then tracking Android will become even more difficult.

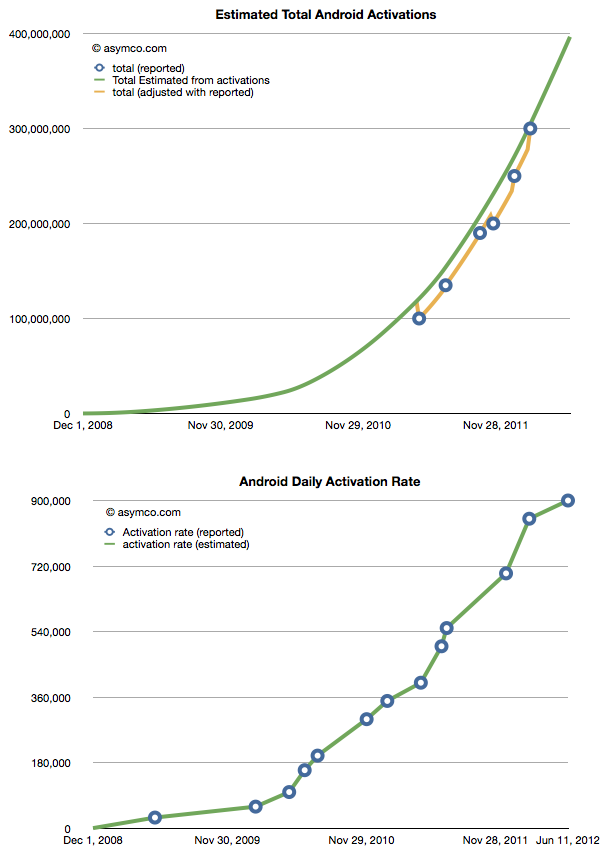
The current total is difficult enough. We just received an update on the activation rate (900,000 per day) and that allows us to create a picture of total cumulative activations.

We still don’t know the retirement rate so these are not devices in use, however Continue reading “Update on Android growth”

Are revenues per app decreasing?

Apple has been releasing data about payments to developers with increasing frequency. Last week’s $5 billion announcement was the fifth such update and came after about one quarter since the last.

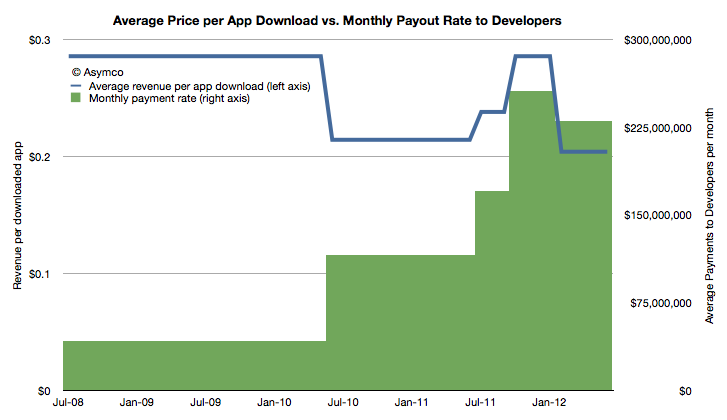
Knowing the payments to developers and the cumulative download count allows us to get a very accurate revenue point for each download. As the frequency increases we can observe growth and seasonality patterns.

The following chart shows how average revenue per app download and the average payment rate to developers has changed since the iTunes app store opened and given the data points available:

The green area in the chart should add up to $5 billion. The average revenue for all downloads is 24c.  Continue reading “Are revenues per app decreasing?”

5by5 | The Critical Path #42: Full Circle

Having just returned from China, Horace gives his impressions which leads to a discussion about industrialization and innovation and how countries “mature” and what is Apple doing in China and the new relationship between Apple and strategic partnerships and the new stats from WWDC 2012 about developer revenues and how that differs from Android and the 400 million Android devices activated vs. 400 million iOS devices built, in China.

via 5by5 | The Critical Path #42: Full Circle.

Asymco

Asymmetric Competition

Skip to content ↓