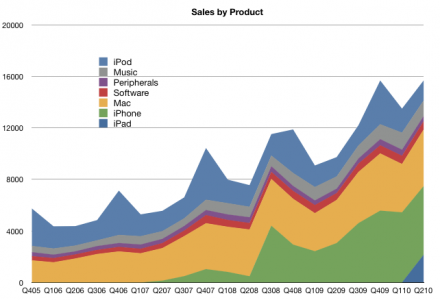
The following chart shows the value of sales per quarter (in $million) since the beginning of 2005. What’s interesting to note is that more than half of sales is contributed by products which did not exist three years ago (iPhone and iPad). Music and iPod did not exist 10 years ago. It’s entirely appropriate that Apple removed “Computer” from its name, though they still sell mostly computers of a different kind.
Day: August 1, 2010
Apple's Valuation Struggle Continues
asymco | Apple’s Valuation Struggle.
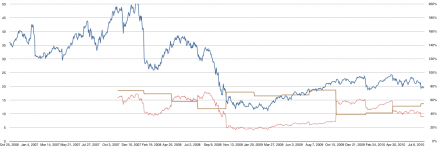
As despondency over Apple’s 75% earnings growth rate continues, it’s time to revisit the historic P/E in contrast to growth for the company’s earnings.
The latest chart (below) shows the company’s P/E ratio (in blue, left scale) vs. the trailing twelve months rolling growth rate (in brown, right scale) and the ratio between these two (in red, right scale).
The red line can be considered a form of PEG (Price over Earnings over Growth) with the caveat the the Growth is trailing not forward and hence is based on actual data not fictional analyst “consensus”. I call this PETG (Price over earnings over trailing growth).
The actuals show that Apple’s price to trailing growth ratio is dropping to lows unseen since last year when the recession was still in effect. At PETG below 20 the predominant sentiment displayed is extreme pessimism. 100 could be considered an even balance between pessimism and optimism. It now stands at 35.
Apple's Growth Scorecard June 2010
Following up on last quarter’s “asymco | Apple’s Growth Scorecard.”
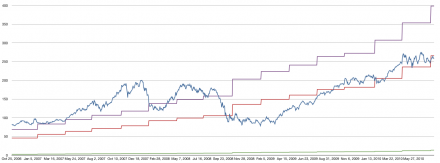
June quarter showed a significant increase in sales growth (due to the iPad) while the iPhone growth moderated to 74%. Overall earnings growth is a solid green.
AAPL price drops below 20x earnings
Apple vs. Correlation fatigue and the ETF bubble
Recent commentary in financial press (e.g. FT Alphaville » Lost in correlation fatigue and The Herd Instinct Takes Over, Amber Waves of Pain) points out how the markets have become insensitive to fundamentals or valuation itself.
Symptoms of this are:
- Global markets trading in lock-step. In an apparent blindness to any local differences, markets from emerging economies to Japan and to London trade in perfect correlation.
- Crude oil and other commodities are mis-priced due to HFT or algorithmic trading which ignores underlying supply and demand fundamentals.
- Value investors find that there is lack of dispersion among stocks.
- Component stocks’ correlation to the S&P 500 is at highest level since ’87 crash, reaching a high of 83% vs. average of 44% since 1980.
- ETFs (exchange traded funds) maintain (or freeze) over- and under-valuations.
Structural changes such as the proliferation of exchange-traded funds and super-rapid computer-based bloc trading, activities that are totally unconcerned with valuation metrics and/or long-term trends, are still taking place and there is little or no prospect of this development coming to an early end.
- Adam Smith’s invisible hand has for the time being, been handcuffed.
It means you can’t trust any valuation. I could have valued a subprime CDO better on May 6 than any equity. And it’s almost the same thing all day long. Valuations and prices have been divorced for a while. Just look at the volatility. It’s not like traditional trading. No wonder there are such increased correlations.
What this has to do with mobile computing? Interestingly, I find that Apple is not just a victim of this de-coupling of fundamentals from valuation. I hold out hope that the stark facts of its performance might actually pop this correlation bubble.
The hope comes from the fact that trading strategies have finite lives. As soon as a strategy develops to a point of being widely used, it makes sense for a contrarian to “short” or bet on the reverse of that trend, taking advantage of the tendency to overshoot. I don’t have a strong handle on this phenomenon, but the chances are that value/fundamental investment will be back with a vengeance and Apple might just be the leader, by sheer weight of numbers.


