Many consider June 2007 to have been a pivotal moment in the history of mobile phones. Apple’s entry with the iPhone has re-defined the market in many ways. However, there was a smartphone market before then. About 28 million smartphones shipped the quarter when Apple launched out of an overall phone market of 265 million. Apple’s entry with 270k phones was a drop in the bucket.
I thought it would be instructive to chart what happened between that quarter, exactly three years ago and today. I collected the data from IDC, Gartner and Canalys and company reports to paint a few pictures.
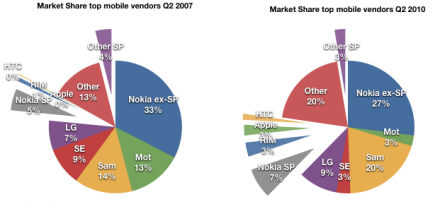
First, the market shares (by units) of the top mobile vendors, Q207 vs. Q210. I highlighted the smartphone vendors by separating their wedges from the pie. Note that I also separated Nokia’s smartphones from Nokia’s regular phones as two separated wedges–Nokia ex-SP for no smartphones and Nokia SP as their “converged” units. I did the same with “other”.

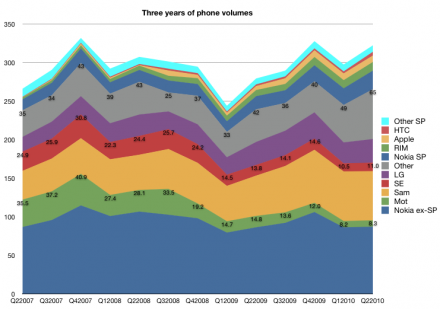
The first thing to note (beside the large increase in smartphone share) is that “other” non-smartphones are a huge part of the pie. At 20%, the share of “other” is now equal to the share of Samsung. Other consists of a group of mostly low cost Chinese vendors. The growth of the low end “other” went from 35 million units in Q207 to 65 million in the last quarter. It’s this competition that is driving profit out of the core businesses of Nokia, Samsung and LG and forcing a flight to smartphones (more about this later).
The second thing to notice is that Motorola and Sony-Ericsson are highly visible victims of the last three years. Sony Ericsson shipped 25 million devices in Q207 and only 11 million three years later going from 9% share to 3%, on par with RIM and Apple. Motorola did even worse, shipping 35.5 million in Q207 and a mere 8.3 million last quarter, losing 10 out its 13 points of share.
Viewing the overall units market, one can see the gouge in units that the recession took out. The following graph shows three years of volumes by the top vendors with the smartphones separated at the top (Nokia SP, RIM, Apple, HTC and Other SP–everything above the grey band are smartphones).

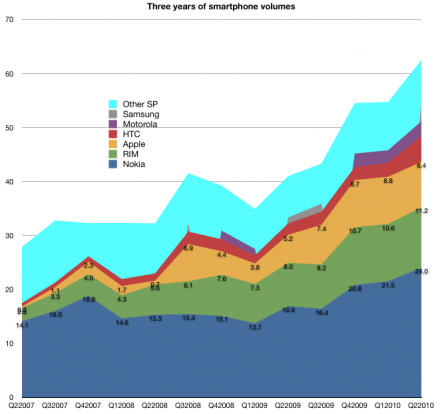
However, separating out the smartphones, one can see their volume increased with barely a ripple during the recession. Although Nokia retains the top share spot, the entrants have jointly grown much faster. I have annotated a few of the competitors’ volumes with the actual values.

One thing to note is that “other smartphones” has traditionally consisted of Windows Mobile licensees but that is quickly shifting now to Android. I also had only fragments of data for Samsung and Motorola, so their bands are incomplete. However, one could note how minimal their participation has been in the market. LG has been practically absent from this market. For these latecomers to smartphones, it’s clear what Android offers: a chance to stay in the game.
Discover more from Asymco
Subscribe to get the latest posts sent to your email.
