
How much does it cost to have the world’s best maps?
The answer may seem simple: $8.1 billion.
That was the cost to Nokia in cash for buying Navteq in October 2007. It would seem that buying that asset (or another one like it) is a cut-and-dried solution to anyone needing a mapping “solution”. But it’s not an answer that is either complete or explanatory of how mapping solutions are valued.
Navteq was not priced as a database for an app. It was a business which was expected to create licensing revenues and profits[1]. The actual price for this business net of cash was $7.7 billion but the following graph shows the net sales and operating profits since Nokia began reporting its performance:
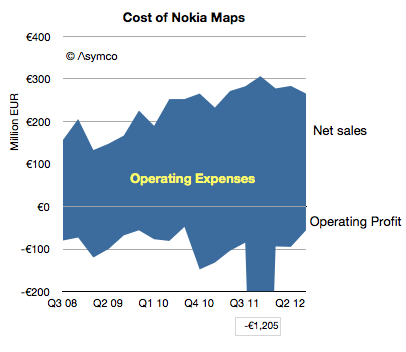
The blue area represents the difference between sales and costs and hence the operating expenses–the payments needed to “keep the lights on”.
These total expenses over the 4.25 year time frame totals €6.5 billion. The total operating losses equal €2.6 billion. Therefore, as far as Nokia’s shareholders are concerned, they paid $11 billion for Nokia maps, to date.
What do they have to show for it?
Nothing. The entire company is now worth only about $15 billion. It’s hard to imagine maps being worth 73% of Nokia. What Nokia hoped to get for the product was some value in its devices. As other issues intruded, that value has not been realized. Nor has any external licensing revenue been realized. Net external licensing revenues are actually decreasing.
The situation looks even even uglier when the maps asset can be seen as costing €1.5 billion every year. Why would anyone want to be in this business?
I bring this up because, apparently, everyone wants to be in this business.
Via Twitter I received a suggestion (rumor?) that Google spends about $1 billion every year for maintaining their maps. (Using a conversion from Euros to Dollars yields a Nokia maps burn rate of nearly $2 billion/yr.) Furthermore, there seems to be a burning desire for Apple to also burn this money.
If so, then Apple might have to start spending $1 to $2 billion/yr to merely maintain a data set. That would be a minimum of an additional 7% in operating expenses.
Why would they do that?
If Apple cannot buy or license quality data, there may be no choice. Maps have become a hygiene factor for a platform. Not having them makes a platform repulsive but having them offers no attraction.
Another way of looking at the maps asset is like a component in a phone. A vendor needs a certain class of processor, memory or screen or battery. Not having a minimum level of functionality makes the product uncompetitive but having it does not guarantee success.
What’s worse, the market may have been cornered—there may be no suppliers. Unlike hardware components, the maps component is not a commodity with a market of suppliers. The work needed to maintain the maps is a commodity but the aggregation and consolidation of the data is valuable and those who have gained control over the data and they are not likely to license it to any competitors for strategic (i.e. political) reasons.
So we have a perverse situation of a very costly, unprofitable asset requiring duplication of maintenance effort by politically motivated actors imprisoned by their own strategic interests.
If so then it fits perfectly with the mobile telecom industry. Like mobile networks, maps are very expensive and worth very little.
—
Notes:
- The revenues that Navteq was obtaining during the 2008/2009 time frame included that from customers such as Verizon, Garmin, Advertising, Traffic services, Microsoft Windows Live services. For the six months ended on December 31, 2008, Europe accounted for 44% of NAVTEQ’s net sales, North America 43%, Middle East & Africa 8 %, Asia-Pacific 2 %, Latin America 2% and Greater China 1%.
—
If you want to learn more about how to analyze technology industries and the evolution of value chains, consider participating in Asymconf.
Discover more from Asymco
Subscribe to get the latest posts sent to your email.