For more analysis of Apple & the industry, join us at ACTIVE 2025.

How many years does Apple have?

The graph below shows the Revenue and Operating Income for a select group of companies. The large numbers represent the share price to earnings (trailing twelve months) ratio (P/E or PE ratio).

Screen Shot 2013-11-06 at 11-6-2.56.25 PM

Of course the P/E ratio hides a lot of subtlety. It mostly fails to account for the fact that earnings are largely a matter of opinion. A company can defer income (as Apple and Microsoft do), it can invest earnings (as Amazon does) and can otherwise avoid declaring it since it’s taxable. Continue reading “How many years does Apple have?”

The diffusion of iPhones as a learning process

All theoretical and empirical diffusion studies agree that an innovation diffuses along a S-shaped trajectory. Indeed, the S-shaped pattern of diffusion appears to be a basic anthropologic phenomenon.

This observation dates as far back as 1895 when the French sociologist Gabriel Tarde first described the process of social change by an imitative “group-think” mechanism and a S-shaped pattern.1 In 1983 Everett Rogers, developed a more complete four stage model of the innovation decision process consisting of: (1) knowledge, (2) persuasion, (3) decision and implementation, and (4) confirmation.

Consequently, Rogers divided the population of potential adopters according to their adoption date and categorized them in terms of their standard deviation from the mean adoption date. He presented extensive empirical evidence to suggest a symmetric bell shaped curve for the distribution of adopters over time. This curve matches in shape the first derivative of the logistic growth and substitution curve as shown below. Screen Shot 2013-11-06 at 11-6-1.51.57 PM

In the graph above I applied the Rogers adopter characterization to the data we have on the adoption of smartphones in the US. The latest data covering September is included.

Continue reading “The diffusion of iPhones as a learning process”

  1. Tarde was probably influenced by mathematician Pierre François Verhulst who first published the logistic function in 1845 []

Do ads work? The ad budgets of various companies

Microsoft spent $2.6 billion for Advertising in the fiscal year ended June. Apple spent $1.1 billion in its fiscal year ended October.

Other companies will report their full year ad spending later but their previous years’ spending is shown below.

Screen Shot 2013-11-04 at 11-4-4.55.03 PM

I added a second graph showing the percent of sales that each ad budget represents. Note that Coca Cola retains the crown as the most prolific advertiser when it comes to budgeting.1

Continue reading “Do ads work? The ad budgets of various companies”

  1. Think of it as 7 percent of every Coke purchase going to pay for the ad that presumably got you to buy it. []

Owing how much to how few?

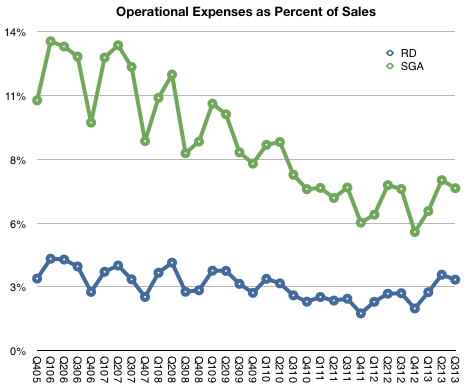
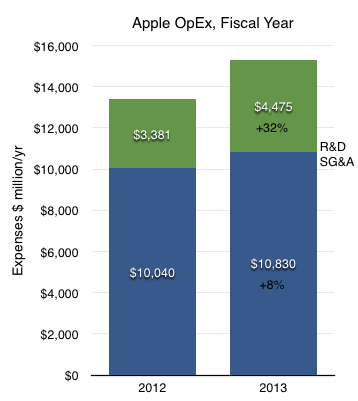
For the year ending October Apple’s R&D costs were $4.475 billion. These costs have been rising. Though, as the company explains, not faster than net sales:

The growth in R&D expense was driven by an increase in headcount and related expenses to support expanded R&D activities. Although total R&D expense increased 32% and 39% in 2013 and 2012, respectively, it remained fairly consistent as a percentage of net sales.

[My emphasis]

We can see this in the following graph:

Screen Shot 2013-11-01 at 11-1-4.37.48 PM

R&D has remained very nearly 3% of sales since at least 2005.


SG&A Expenses barely grew however:

The growth in SG&A during 2013 was primarily due to the Company’s continued expansion of its Retail segment and increased headcount and related expenses, partially offset by decreased spending on professional services.

The change in R&D and SG&A on a full-year basis is shown below.

Screen Shot 2013-11-01 at 11-1-4.42.06 PM

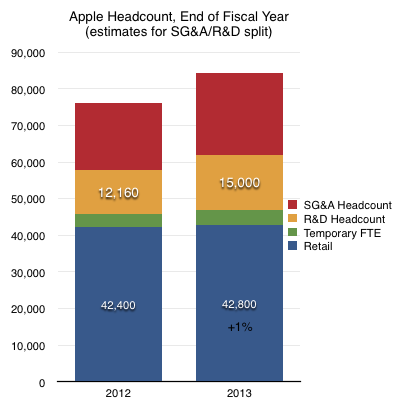
I emphasized the mention of increases in headcount. We cannot know with any precision what portion of last year’s $15 billion in operating expenses went toward wage expenses since there are other costs such as advertising1 commissions and public relations in the case of SG&A and outside services, equipment leases, in the case of R&D. However, it’s more likely that wage expenses are a far larger proportion of total R&D than they are of SG&A.

My estimate, based on wage rates, is that there are approximately 15,000 R&D staff at Apple.

Screen Shot 2013-11-01 at 11-1-4.42.49 PM

If we divide sales by this number we get $11.4 million in sales per engineer.

  1. Apple’s advertising expenditures for fiscal 2013 were $1.1 billion or 10% of SG&A or 0.64% of sales. []