
 The fact that AAPL is less valuable — in terms of the P/E ratio — than the average S&P 500 company continues to baffle me.
Apple’s P/E is a bit misleading because of the price “P” a large part is cash which should not be considered “at-risk” capital.
The logic of a P/E ratio is to measure how many years it might take to recover one’s investment. The cash on the balance sheet is not at risk for this calculation. Therefore the Enterprise Value /Free Cash Flow is a more accurate measure of company value creation. Until the recent re-statement the FCF and Earnings were divergent. They have since become equivalent.
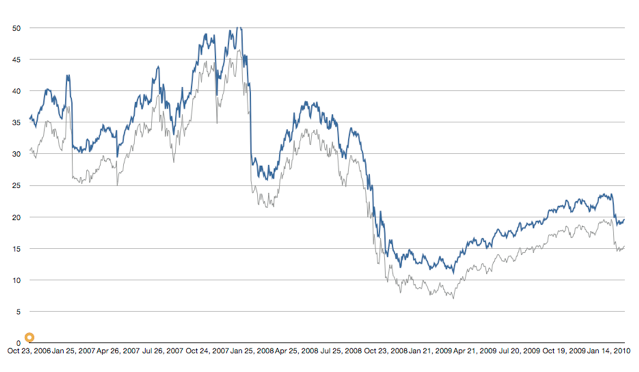
Therefore, if you take cash out, (currently $43/share) the Enterprise Value / Free Cash Flow for Apple is about 15. It had bottomed at 7 (now that we have restated data we can go back and re-calculate this).
The graph above shows the traditional P/E in blue and the EV/FCF in grey (using restated financials).
On a forward basis the EV/FCF is probably around 12 to 13.
Also of note is that Apple’s EV/FCF is lower than the S&P 500 (at 23.52 at the end of Q4 2009.)
If we continue to use the S&P as a comparable, I looked up the estimates for quarter-end P/E for the S&P 500:
12/31/2011 17.15
09/30/2011 18.35
06/30/2011 19.97
03/30/2011 21.61
12/31/2010 23.00
09/30/2010 24.43
06/30/2010 22.57
03/30/2010 21.54
12/31/2009 23.52
Apple EV/FCF (and also traditional P/E) are lower than S&P on current and forward bases.
How do we read this? Is the market considering that Apple’s prospects are less than the average large company? This does not quite make sense to me. What other theory could be at work to explain this valuation?
S&P estimates are sourced from:http://www2.standardandpoors.com/spf/xls/index/SP500EPSEST.XLS
Discover more from Asymco
Subscribe to get the latest posts sent to your email.