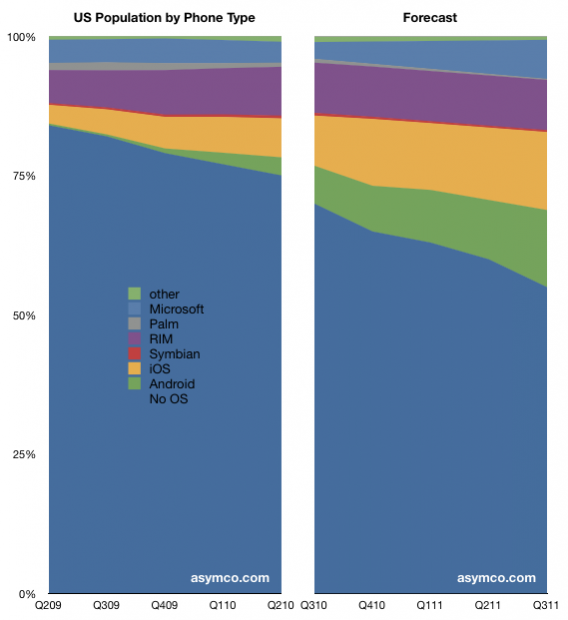
Since wireless subscriptions in the US are running at about 100% penetration, it’s possible to classify the wireless subscribers as representative of the entire population. So it’s safe to categorize the population of the US by the phone OS they carry.
The left part of the chart shows data from Nielsen that breaks up the population by the OS to date. The right part of the chart shows my estimate for how the platform shares will evolve by this time next year. The non-OS share will still be above 50% but it looks like it might shrink even more rapidly after reaching a tipping point of half the market. (Note these charts do not show quarterly sales but installed base of each OS).
My hypothesis remains that smartphone user bases will be balanced (or fragmented, depending on your point of view) by operator portfolio decisions and chronic constraints on distribution.


