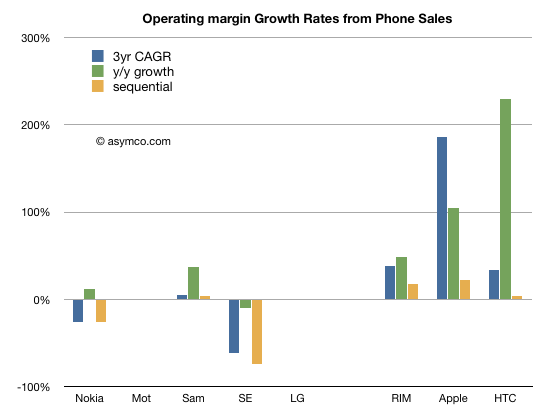
Operating profits for the eight vendors I track increased at a compounded 25% over three years. As with revenues, the growth is concentrated. The following chart shows operating profit growth across three time frames: three year compounded, year/year and sequential. Loss-making vendors are excluded from this chart.
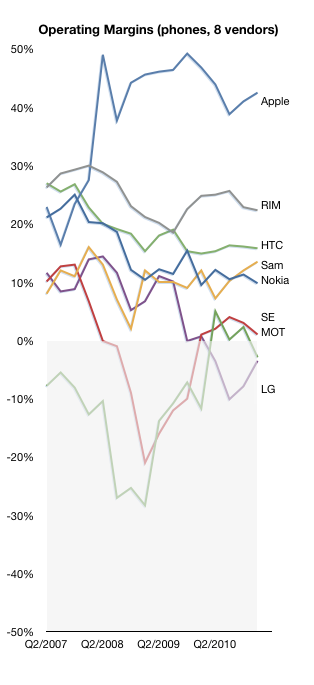
Looking at individual performance, the following chart shows how each vendor performed over time:
The mobile industry has historically been unforgiving. Companies that fall into unprofitability tend to stay there or exit/merge. This has claimed many: Ericsson, Siemens, Alcatel, BenQ, Palm, Sony, Toshiba, Handspring, NEC, Hitachi, Casio.
LG, MMI and Sony Ericsson are all in the same precarious situation. We’ll have to watch carefully whether a recovery is possible for any of them and whether Nokia will reach the same rocky position.
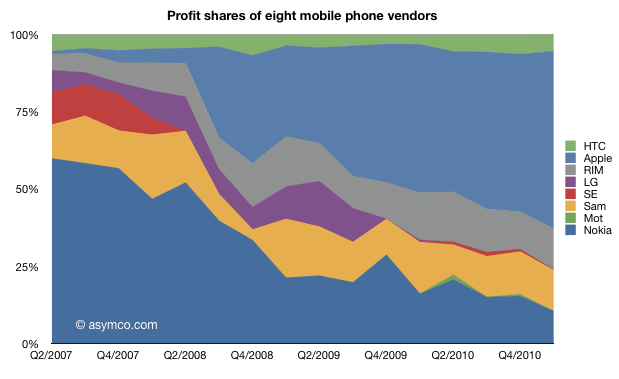
Looking at operating profit shares, the picture is plain to see. While RIM, Samsung and HTC have maintained profit share, between 2007 and now, profit share has mostly shifted from Nokia to Apple.
But this does not tell the whole story. Here are the absolute amounts of operating profit from mobile phones. Exactly three years ago Nokia was earning 47% profit share or $2.35 billion. This past quarter Apple’s 57% was equivalent to $5.23 billion, more than twice as much.
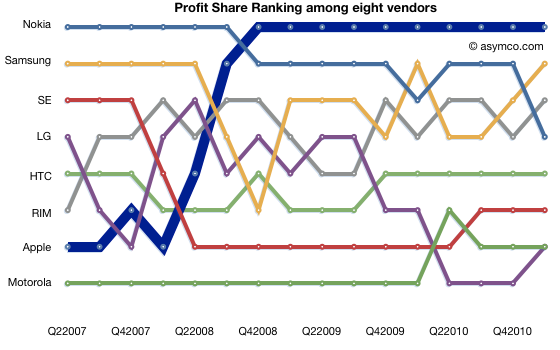
Finally, the league table shows how Nokia has now dropped from second to fourth in the last quarter. Not only Samsung, but RIM has overtaken Nokia as well.
It’s become routine to see Apple at the top of the list of profit earners from mobile phones.
Discover more from Asymco
Subscribe to get the latest posts sent to your email.


