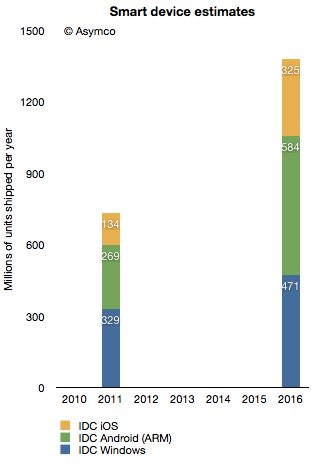
In terms of platforms, IDC expects a relatively dramatic shift between 2011 and 2016, with the once-dominant Windows on x86 platform, consisting of PCs running the Windows operating system on any x86-compatible CPU, slipping from a leading 35.9% share in 2011 down to 25.1% in 2016. The number of Android-based devices running on ARM CPUs, on the other hand, will grow modestly from 29.4% share in 2011 to a market-leading 31.1% share in 2016. Meanwhile, iOS-based devices will grow from 14.6% share in 2011 to 17.3% in 2016.
Via: IDC – Press Release – prUS23398412
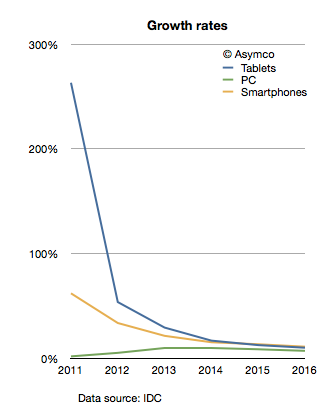
The company provides a stacked bar chart (follow link above) to illustrate their view of the market. I took the data they included and measured the implied growth rates for the product categories:
IDC is implying that in four years the tablet market will be growing at 10%, the Smartphone market will grow at 11% and the PC category will grow at 11%. In other words, five years from now the PC market is expected to grow faster than the tablet market and just as fast as the smartphone market!
What’s more remarkable is that this situation is not going to happen in four years. The slowdown in growth is actually expected much sooner. The growth rates two years from now are expected to be: Tablets 17%, Smartphones 15% and PC 10%. IDC is unequivocal: by 2014 the good times will come to an end to the post-PC challengers. These growth rates would be catastrophic for share prices and the value propositions of the new platforms to developers, partners and consumers.
What’s more, these growth rates are striking not only because they predict a collapse in the value of most market challengers but that they also predict a strongly resilient PC market. How can we test this forecast?
I tried to reconcile this doomsday scenario with what is known about the components making up the data. I.e. what “bottom-up” data is IDC using? In the quote above, IDC offers some insight into this market participant data. Based on the category and share data they published it’s possible to infer the following:
Bearing in mind that neither iOS nor Android existed five years ago, we can observe they are bigger together than the PC market. And yet, IDC predicts a compounded average yearly growth rate of 16.7% in Android, 19.4% in iOS and 7.5% in Windows between today and 2016.
In aggregate, IDC forecasts that in the next five years Android will not manage to double and that iOS will only increase by a factor of 2.4. Is this believable?
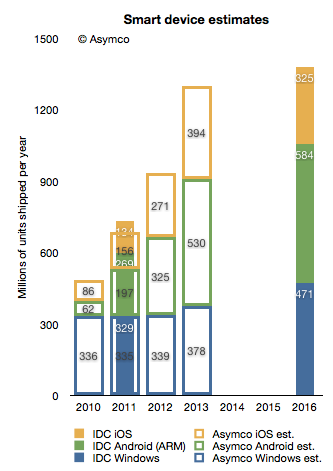
I try to stay away from long term forecasts, but I do maintain a short term forecast based on recent growth data. My forecasts for this year and next year are shown below.
I super-imposed my short-term forecast (outline bars) on IDC’s long term forecast (solid bars) and a several differences become apparent.
First, my 2013 forecast is nearly the same as IDC’s 2016 forecast. To see why we need to look at each platform separately.
Perhaps we might (with difficulty) agree on Microsoft’s potential. I believe Windows 8 will have a catalyzing effect and that Microsoft will begin to see its platform grow again. However, my expectations are modest. To increase Windows sales rate by 100 million units/yr between 2013 and 2016 is possible but ambitious.
The real problem is that our Android and iOS forecasts are outside any zone of possible agreement. Maybe there is a difference in what we measure. For a hint, we seem to disagree on the number of Android devices shipped in 2011. I used Google’s own reports of activations to work out the yearly shipment estimates. Perhaps IDC is including versions of Android that are not Google sanctioned.
We also disagree on the 2011 iOS figures. I obtained 156 from Apple’s own reports. Again, perhaps the difference is the inclusion of the iPod in my case.
Nevertheless, the difference in the long term cannot be accounted for only through these categorization differences. I would put the cause of the difference down to the methods used in forecasting. As can be seen from the first chart above, IDC’s growth rate reductions are extraordinarily steep. Perhaps the approach used by IDC was to forecast the overall market growth and then assignment of shares to participants. This can be called the “top-down” approach. In contrast, my approach is to forecast growth rates based on recent growth rates and moderating these rates gradually. This can be called the “bottom-up” approach.
My experience and all the data I’ve ever collected about historic disruptions tell me that the entrants tend to win these types of paradigm shifts. They win through a vast expansion of consumption and the recruitment of non-consumers. Markets tend to experience vast shifts in composition. If we believe this to be true then the bottom-up approach focused on entrants is likely to be more effective vis-a-vis the top-down approach of projecting steady state markets and the implicit assumption of incumbent share preservation.


