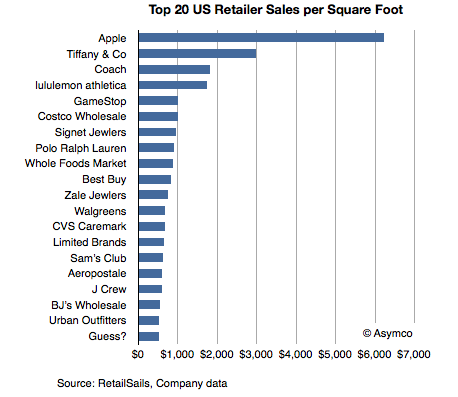
Thanks to RetailSails we have some data on retailers in the US which can be used to calibrate the performance of Apple retail. RetailSails compiled a table of the top 20 chains by sales per square foot (annual basis). The total sample was 160 American retailers (excluding restaurants) that publicly report results.
Sales per unit area is a standard and usually the primary measurement of store success. Here are some benchmark figures:
- Annual store sales in the range of $300 per square foot is considered respectable in the US.
- The US national average for regional malls is $341.
- The average for specialty apparel retailers is $400 per square foot.
- The average for jewelers is in the range of $600 per square foot.
- The median for the best 20 US retailers is $787/sq. ft.
The data for the top 20 is shown in the following chart:
The data shows Apple leading by a significant margin. It’s more than twice as efficient as the second place Tiffany and Co. It’s also more than seven times the median of the top 20 and seventeen times better than the average mall retail space.
Note also that this data includes only physical retail and excludes e-commerce, catalog or services revenues. It should only be used to compare physical retail performance.
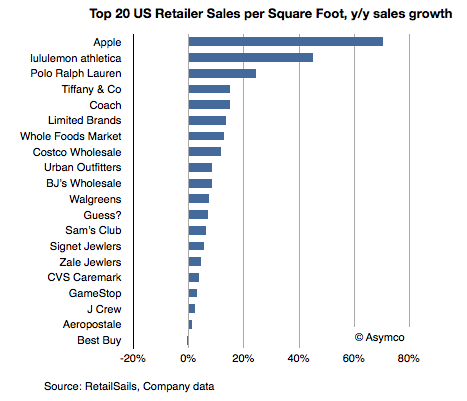
The achievement is also remarkable when measuring growth in overall sales.
Apple leads in absolute performance but also in growth.
Note also the performance of electronics retailers that might be comparable to Apple. Only Best Buy and GameStop are on the list, but their growth is among the poorest, with Best Buy going in the wrong direction (data was current as of August 2011).
We’ll be getting an update on Apple retail at the next earnings call in a few days. To read more about Apple retail see:
Apple retail growth data | asymco
The growth surprise in Apple retail | asymco
Discover more from Asymco
Subscribe to get the latest posts sent to your email.


