
In 2011 Apple increased the availability of the iPhone by adding operators. In 2012 Apple increased availability by bringing the phone to operators more quickly. The question is: how much did iPhone 5 availability increase, exactly?
There is a way to find out. As an approximation, Apple periodically reports the availability of new iPhones by country. For example, Apple stated that they reached 100 countries for the iPhone 5 before 2012 ended. They also gave similar launch data for the iPhone 4S. Graham Spencer did a good job showing how country roll-outs changed over time.
However, country-level availability is not ideal because countries vary greatly in their ability to absorb iPhones. Announcing availability in Mauritius is not nearly as important as announcing Madagascar. A better measure would be to track the countries’ populations being added, or, better still, the populations which subscribe to operators who have a distribution contract with Apple.
Which is what is shown in the following graph:
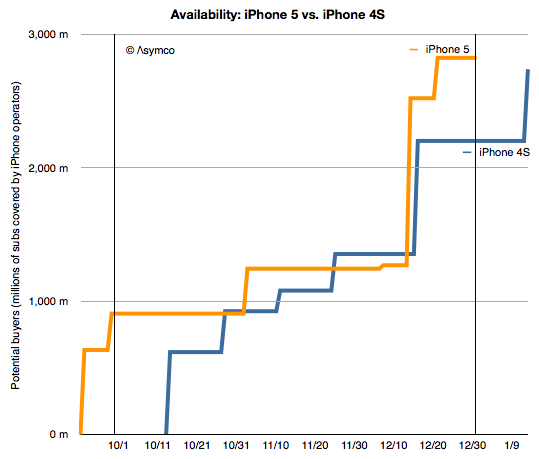
I plotted the “potential buyers” as the number of subs addressed by iPhone-carrying operators in the launch countries according to the time when the launches happened. I did so for the iPhone 4S in 2011 and the iPhone 5 in 2012[1].
Now we can address availability as the area under each of these lines.[2] The figure for the iPhone 4S adds up to be 100 billion “subscriber-days”[3] and for the iPhone 5 it’s 130 billion subscriber-days during Q4 2011 and Q4 2012, respectively.
That’s a handy measure: the iPhone 5 was 30% more available than the iPhone 4S. The big contribution was having China and Indonesia available during the fourth quarter rather than in January 2011.
There are a few observations which follow:
First, note that the increase in availability (area between the orange and blue lines) occurred both early and late in the quarter. The early period was mostly due to early launch in the US and the later period was due to earlier launch into China. China buying patterns are different than those in the US due to differing festive seasons so the bulk of Chinese buying may not happen during the fourth quarter.
However, delivery of product to China started earlier and there was a burst of buying (two million units in three days.)
Production should follow the availability schedule so it would be sensible to reduce production once the pipeline is full. Note that supplier cuts rumors surfaced right around the increased availability date of mid-December. Last year the rumors surfaced in November.
Increased availability does not always lead to increased sales but the iPhone 5 was constrained for longer than the iPhone 4S so it’s possible that demand was therefore higher.
Increased distribution does not always mean increased production. However, Apple’s investment in production tooling doubled year/year so there is a possibility that production did increase.
—
Notes:
- Subscriber data is approximate. See addressable market discussion here.
- The measurements are for the calendar quarter only, as bounded by the vertical lines.
- A subscriber-day is a measure of availability where one subscriber has access to buy the product for one day.
Discover more from Asymco
Subscribe to get the latest posts sent to your email.