
I expected Apple’s margins to improve last quarter. They didn’t and so the question I needed to answer is why. Here is a history of Apple’s gross margin and operating margin as reported since late 2005:
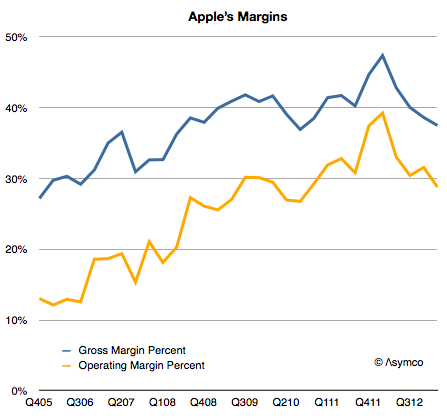
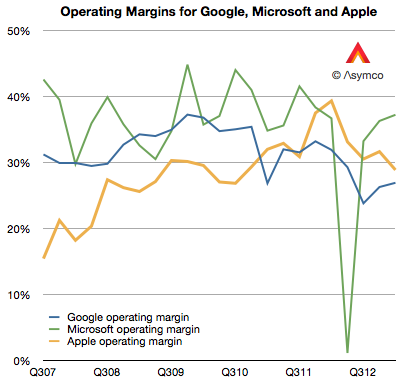
For a company selling hardware these are extraordinarily high margins. They are higher than those of Google and have narrowed the gap with Microsoft, neither of which has a high proportion of hardware sales:
 But they are not growing and the reason is to be found in the reason they grew in the first place: because of proportion of iPhones making up the total sales.
As a reminder, the iPhone is a uniquely profitable product. I estimate that it obtains about 50% gross margins. The history of these estimates is shown below:
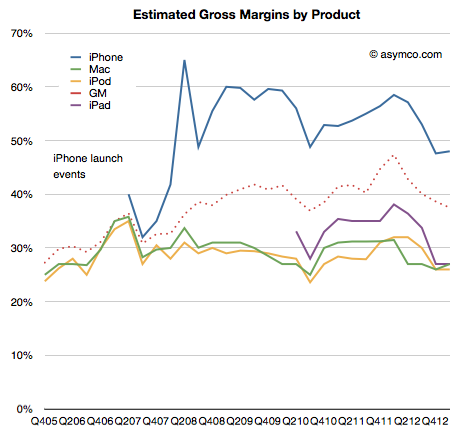
It remains in stark contrast to the margins Apple obtains for its other products. Much of that is due to the pricing power of the product as shown below:
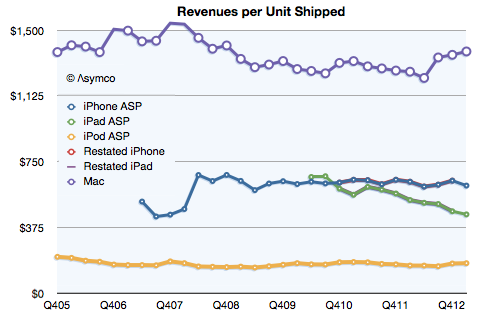
Notice that even after the launch of the iPhone 5 and the persistence of two previous generations of iPhones (and their lowered pricing) has barely put pressure on pricing.
Contrast that with the iPad. As its breadth of offerings increases, it causes a lower price per unit. The iPhone is now at $613 per unit, even with two older generation products available. (The lowest price was in Q2 2012 when the average price was $608.) The iPad is at $449 per unit, down from $662 at launch three years earlier.
So overall, margin is a function of three things:
- Price changes: iPhone had a small reduction (from $635 to $613) but the iPad has had a moderate reduction in price (from $531 to $449).
- Cost of components: This is reflected in product-line gross margins which can only be estimated. Compared to last year I estimate that iPhone gross margin dropped from 58% to 48%. iPad margins also fell from about 38% to 27%. The reasons were given by management as “Last year, our business benefited from …a more favorable foreign currency environment, and historically low costs.”
- Mix of high and low margin products. The iPhone units grew at 7% but the iPad units grew by 65%. A year ago iPhones were 58% of revenues and this year they were 53%. The iPads were 17% and now they are 20%.
The result is seen in this one graph showing the allocation of revenues and margins by product:
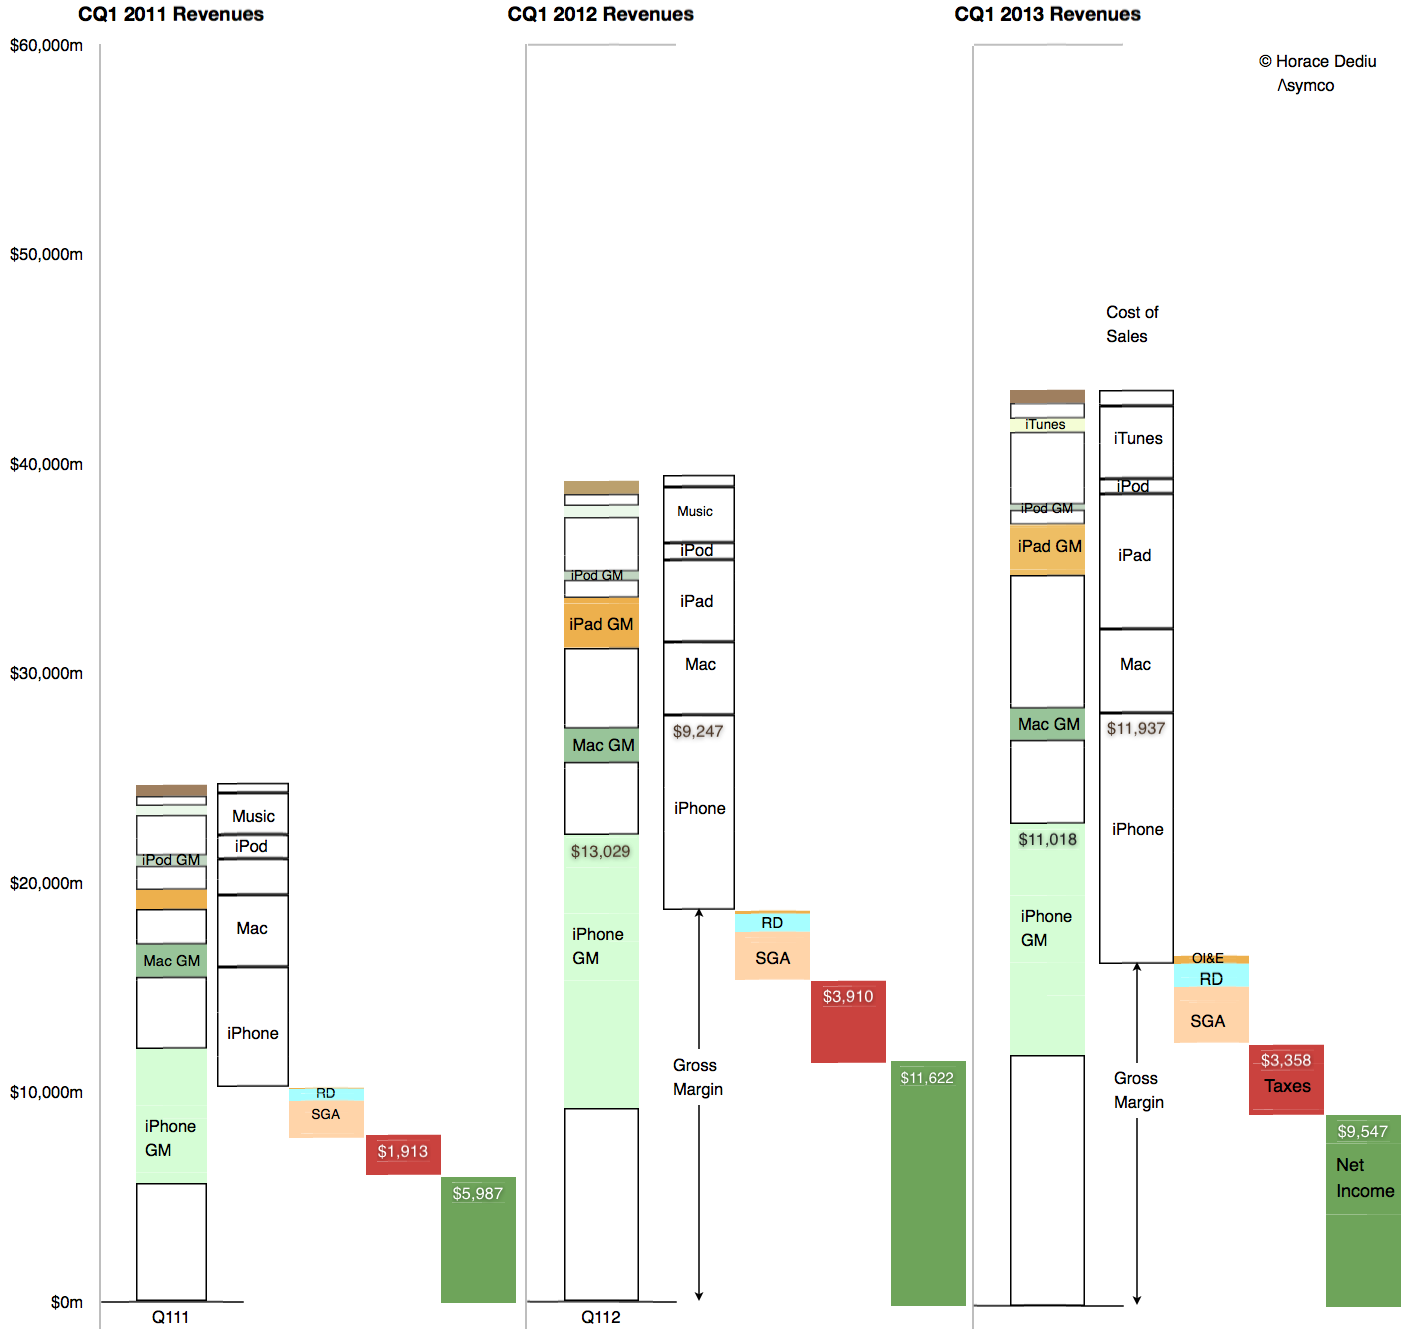
So what is surprising? My expectations were met in terms of iPhone units (and exceeded in terms of iPad units). The mix was also something that falls out of the unit expectations. The pricing is also not surprising.
My guess is that the largest contribution to the “reduction of margin” is the increased cost of components. Note that the graph implies that even though iPhone revenues were nearly flat at 3% growth, the cost of those revenues went up by 29%! In addition, the iPad revenues grew 40% while costs went up 65%.
Unit pricing (and implicitly competitive pressure) is still not the primary cause of the reduction in Apple’s margins. Indeed, the curious thing is that margins are now at levels seen for most of 2009 and 2010, a time when the iPhone (and iPad) were seen as near monopolies in their respective categories.
Discover more from Asymco
Subscribe to get the latest posts sent to your email.