
IBM Digital Analytics Benchmark (report is here) has published, for the fourth year in a row, US online shopping traffic data with a split between mobile and fixed online traffic. It reveals a pattern of consumer behavior which is quite startling: people seem to prefer to shop using mobile devices.
The data is shown below:
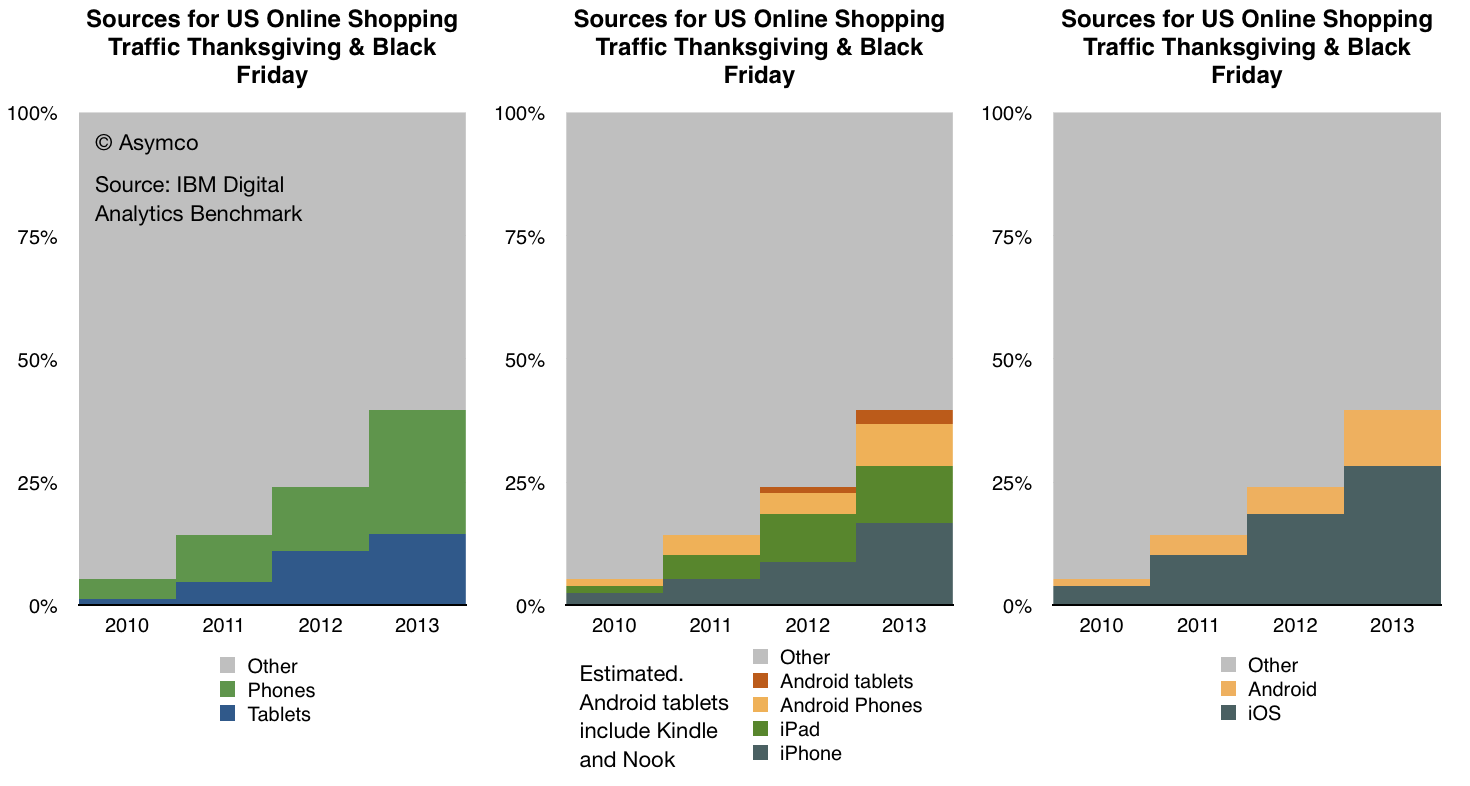
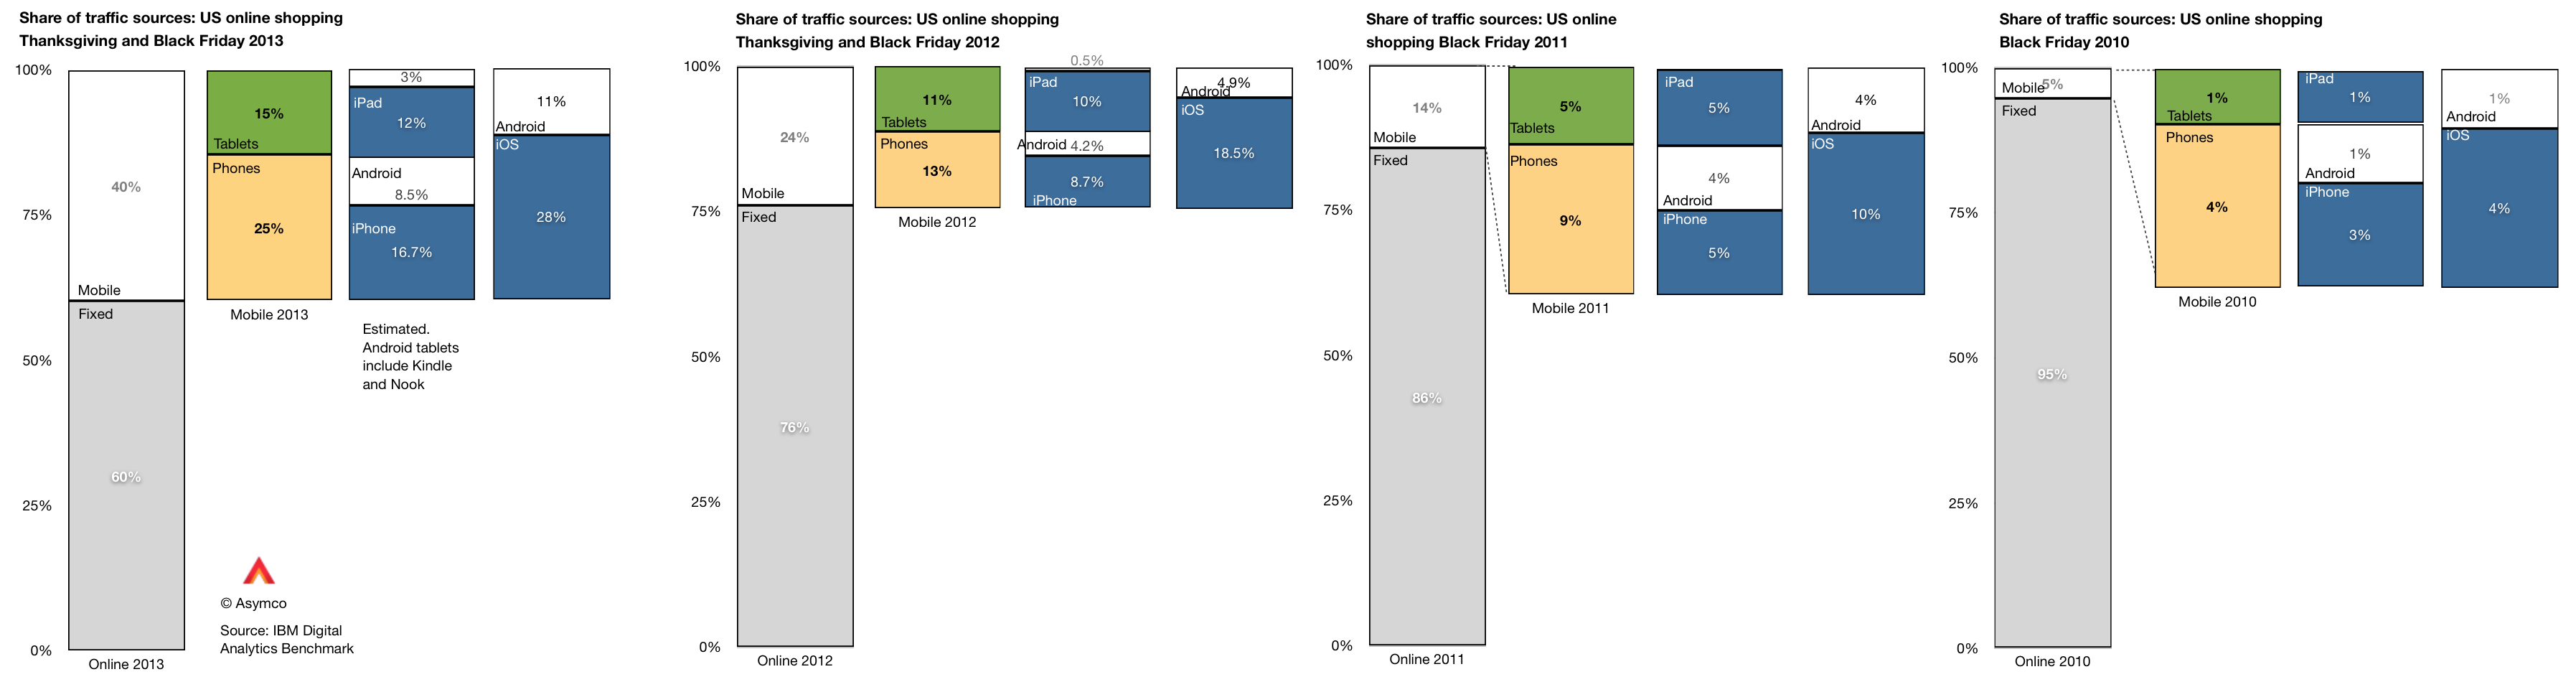
In terms of sources of traffic, mobile devices (including tablets) have increased from about 5% of all online traffic to 40% in four years. Last year the volume was 24% implying that 16 points of share were gained in one year. If that is extrapolated to next year then more than half of holiday shopping traffic in 2014 will be on mobile devices.
Put another way, next year less than half of users will hire a PC for the job of online shopping.
If this conversion from PC-based shopping to device-based shopping follows a logistic substitution curve then the conversion to devices will probably be 90% complete in another 5 years or by 2018 or 2019. I see no reason why this particular job to be done (shopping) should not be considered a proxy for other jobs as well. Therefore it’s not a stretch to imagine that the transition to post-PC consumption will also be practically completed by 2020.
Within the data there is also a significant amount of detail beyond the mobile/non-mobile split in behavior. There is a distinction drawn between tablet and phone traffic and a further distinction between Android and iOS devices.1
This more detailed view of the traffic is shown in the following diagram:
A few observations:
- The pattern of slowing tablet growth is likely due to the slowing growth in iPad sales. This itself is due to the lull in product launches as the shift to fall only iPad releases took place in 2012.
- The consequence is that iPad traffic contribution only increased by 2 percentage points, from 10% in 2012 to 12% in 2013. Compare this with the doubling the previous year (from 5% to 10%).
- Among phone users, both Android and iOS grew their contributions to traffic by roughly 100%. Android phone traffic increased from 4.2% of all traffic to 8.5% and iPhone traffic increased from 8.7% to 16.7%.
As we also know the approximate number of phone users for each platform (via comScore) then we can also determine the per user contribution of traffic of each platform.2
The measure is “basis points of traffic per million users” and it is the result of taking the traffic data (in percent of total online traffic) and dividing by the population of users of a particular platform. The result is shown below:
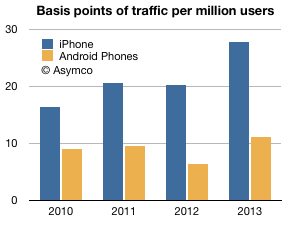
The way to read it would be that each million iPhone users generated about 28 basis points of traffic while each million Android users generated about 11 basis points of traffic.
A way to compare these audiences would be to define the ratio between traffic usage by platform user. That ratio was
- 1.83 (iOS:Android) in 2010
- 2.16 in 2011
- 3.15 in 2012
- 2.51 in 2013
So, as far as phones are concerned, US iPhone users are about 2.5 times more likely to shop online than US Android phone users. The data is reliable: with the US population now over 65% penetrated with smartphones, these populations of users (totaling over 130 million) are vast and representative. As the technology is reaching deep into the late adopter segments the difference in behavior between iOS and Android usage is becoming easier to explain. We have to eliminate quirks of demographics or income or other possible causes.
The platforms themselves are becoming the last remaining suspects as causes for differences in the behavior of their users.
It may seem preposterous to suggest that a platform can affect shopping behavior but let’s remember that the PC, the subject of this article, is a platform in itself. The migration of usage away from the PC to alternatives can only be explained by the alternatives being superior at the particular job that needs doing. The argument is naturally extendable to each alternative individually.
- The split between Android and iOS for tablets and phones was not published for 2013 but I extrapolated from previous years and assumed that 80% of tablet traffic was sourced from iPads vs 88% in 2012 and 99% in 2011. Note also that non-iPad traffic is assumed to be Android but that includes the Kindle and Nook products which are using partial and unsanctioned versions of Google’s Android. [↩]
- Note that this is phones only. [↩]
Discover more from Asymco
Subscribe to get the latest posts sent to your email.