Breaking the Law

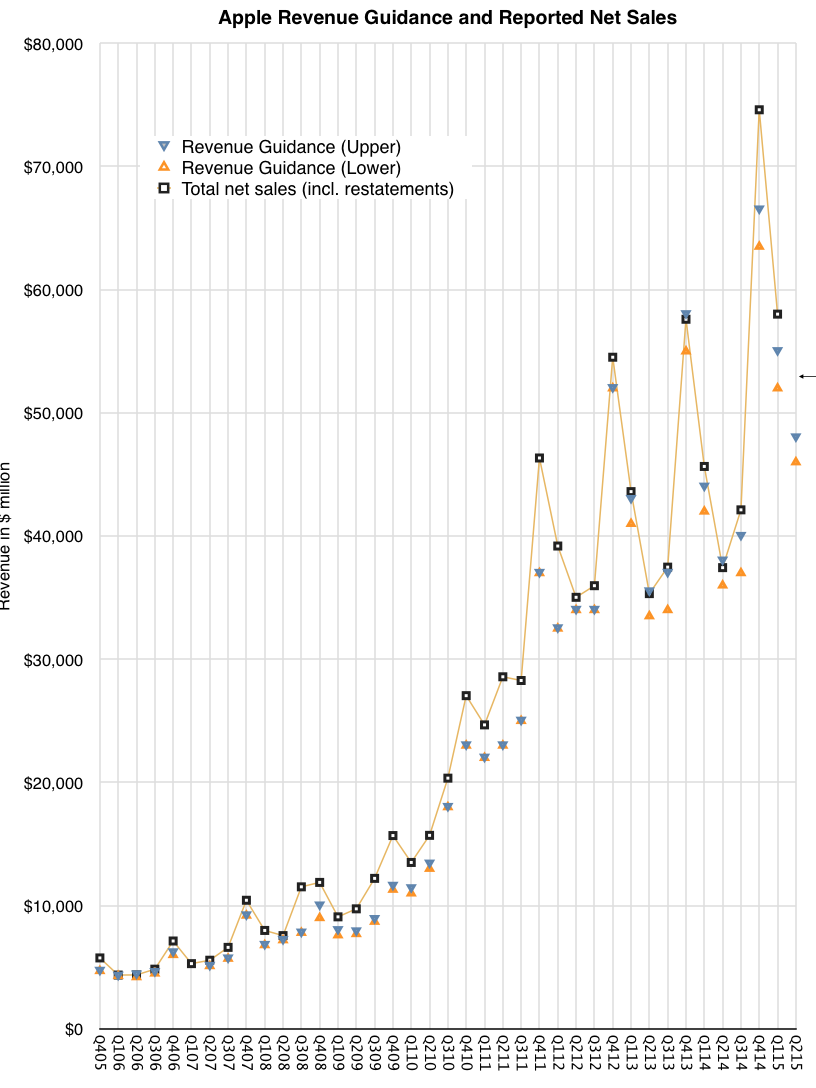
For the first time in many years I feel that there is some potential uncertainty in the results Apple will announce. After a period of excellent accuracy (shown in graph below), the company’s guidance has begun to diverge dramatically from reality and the trend might continue this quarter. The cause might be unanticipated demand for the iPhone 6/6 Plus. The growth rate for the product was 46% in Q4 and 40% in Q1. This is unanticipated because growth rates have been below 20% for five quarters and below 50% for eight.

Screen Shot 2015-07-13 at 12.21.00 PM

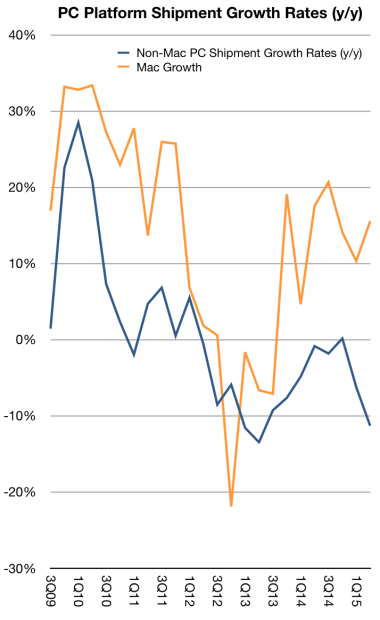
This slowing of growth was explainable given the rate of diffusion of smartphones in the global population. Within the US and some other early adopting economies the market is reaching late stages where most people have switched to smartphones. Globally we are at a more modest 30% or so but in many of the late adopting economies Apple does not have wide distribution.

Of course this thesis is thinly supported. There are many reasons to think that late adopters would still start with iPhone and that earlier adopters of Android would upgrade to iPhone after a few purchase cycles. Thus, the iPhone could prosper in later-adoption or even in post-saturation states of the market.

Indeed, in the post-saturation PC market, Apple is doing very well with the Mac and in the late to post-saturation MP3 player market the iPod did extremely well. This suggests that when it comes to value capture brand, experience and satisfaction trump function, price and share considerations in almost all consumer markets1

With so many assumptions put asunder the iPhone business suddenly looks downright lively. I adjusted my own growth assumptions and the resulting figures are shown below. Continue reading “Breaking the Law”

  1. Enabled by design for jobs to be done. See non-technology markets for abundant evidence of this. []

iOS v. Windows and Immunity to Disruption

The pattern of Mac growth exceeding Windows PC growth (and overall PC growth which includes the Mac) is old news. It has been observed for at least 40 of the last 42 quarters.

Screen Shot 2015-07-10 at 12.47.04 PM

It’s a historically interesting contest, but the story of computing has moved on.  Starting with building computing, via floor computing, office computing and then to desktop computing and portable computing we are now in the era of mobile computing.1. The problem with observing mobility in general is that there are too many mobile computing options. Phones have a wide range of capabilities, tablets and various other form factors are positioned on differing jobs-to-be-done. Platforms and services are also scattered around jobs which have been carved from fixed computing or have been established with no fixed precedent.

So can we pinpoint with any accuracy the moment when the tipping point has been reached? We could point to all mobile phone shipments, or even the vaguely-defined smartphone shipments compared to all PC shipments. We could look at tablets alone. If we could get accurate measurements.

One measurement could be to look at operating systems alone. When comparing iOS shipments (iPhone, iPad and iPod touch) to Windows we can see that combined iOS shipments exceed all Windows PC shipments for all three previous quarters. Continue reading “iOS v. Windows and Immunity to Disruption”

  1. And as sure as the sun will rise tomorrow we will move beyond mobile computing []

John Gruber’s The Talk Show: ‘THEY BUY A HOLE IN THE WALL’, WITH GUEST HORACE DEDIU

Special guest Horace Dediu joins The Talk Show for the first time. Topics include the state of the maps industry, Apple’s functional organizational structure, what the WWDC keynote said about the state of the company today, and more.

The Talk Show: They Buy a Hole in the Wall.


What next for iPad?

ComScore suggests that there are 100 million tablet owners in the US. On a per capita basis that implies penetration of about 30%. As a percent of mobile phone subscribers (above age of 13) that implies 40%. As a percent of smartphone users that implies 43%. As a percent of iPhone users that represents 47%. As a percent of households assuming one device per household that implies 85% penetration. By another measure (Pew) household penetration is around 50%.

Regardless of the difficulty in defining what is the correct “addressable market”, the more important question is whether tablets will be an ubiquitous object. Perhaps what we are seeing in the US is something similar to the MP3 player market or video game console markets where penetration saturated at around 50%. Perhaps tablets will reach PC levels which are closer to 80% of population or perhaps they will reach phone levels which are above 90%. The reason we can’t answer the question of ubiquity easily is because competing solutions can carve the usage out of a category “disrupting” it with alternatives.

The idea that jobs are the segments into which products fit and not demographics or product attributes is key to understanding this migration. The reason phones have subsumed more jobs onto themselves is because they have a rapid rate of evolution and because they have larger scale of economy and because they are conformable to our life spaces. As phones get better they take on more jobs and some of those jobs are those of tablets. The MP3 did not become ubiquitous because the phone took its job. Same for the video game and same perhaps for the PC and tablet.

Continue reading “What next for iPad?”

Where are Maps going?

At the 2015 WWDC Apple stated that it receives 5 billion requests per week for its maps service. It also said that Apple maps is used 3.5 times more frequently than “the next leading maps app.”

These two data points are the total number of data points we have about the global maps market. Neither Google nor Nokia provide usage or share or performance data. Regardless, commentary on the usage, share and performance of Apple Maps has been abundant for the three years since its inception.

The data presented allows us to make a few estimates for the first time and we can hope that additional data can allow a picture to emerge of where maps are going.

With these first two data points we can finally make some estimates. But some assumptions are still needed: We need to assume that the “next leading maps app” is Google Maps. Although there are other maps apps on the iOS platform they are probably insignificant and it’s a two-horse race between Google and Apple on iOS.

This means that the 3.5:1 split in usage results in a 78% share for Apple Maps and a 22% share for Google. If we assume that there are about 400 million iOS users of maps1, it leads to about 90 million Google Maps users on iOS and about 310 million Apple Maps users on iOS.  This includes iPad.2

Given that Google also reported 1 billion downloads in 20143 we can assume between 25% to 33% Apple Maps “market share” of usage.

Continue reading “Where are Maps going?”

  1. Note that not all iOS users are maps users. Maps are not used by all users []
  2. We are excluding OS X use of Maps. []
  3. though not necessarily all of these downloads lead to active use, obviously []