Every October, at the end of its fiscal year, Apple files its Form 10K or annual report. In this report the company includes a section titled “Capital Assets” which details expenditures for capital equipment. This is last year’s entry:
The Company’s capital expenditures were $14.9 billion during 2017. The Company anticipates utilizing approximately $16.0 billion for capital expenditures during 2018, which includes product tooling and manufacturing process equipment; data centers; corporate facilities and infrastructure, including information systems hardware, software and enhancements; and retail store facilities.
Note that there are categories of spending detailed and that their order might indicate the degree of such spending, suggesting that product tooling and manufacturing equipment is likely to be the costliest category.
After this report, during subsequent quarters the company may update this forecast of spending. In the last (third fiscal) quarter the entry was as follows:
The Company’s capital expenditures were $11.1 billion during the first nine months of 2018 . The Company anticipates utilizing approximately $17.0 billion for capital expenditures during 2018, which includes product tooling and manufacturing process equipment; data centers; corporate facilities and infrastructure, including information systems hardware, software and enhancements; and retail store facilities.
Note that the forecast of $16.0 billion was updated to $17.0 billion and the first 9 months’ expenditures were $11.1. Since there is only one quarter remaining1 it’s reasonable to assume that the company’s forecasts are more likely to be precise and that therefore the difference between total expected spending and already spent, i.e.f $5.9 billion remains to be spent.
The actual spending is not recorded quarterly but an approximate value is reported in the Cash Flow statement as “Payments for acquisition of property, plant and equipment”. That can be tracked but it does not equal exactly the capital expenditure. For example, the quote above says expenditures were $11.1 billion through first 9 months but the total of all payments for acquisition of PP&E is $10.272 billion.
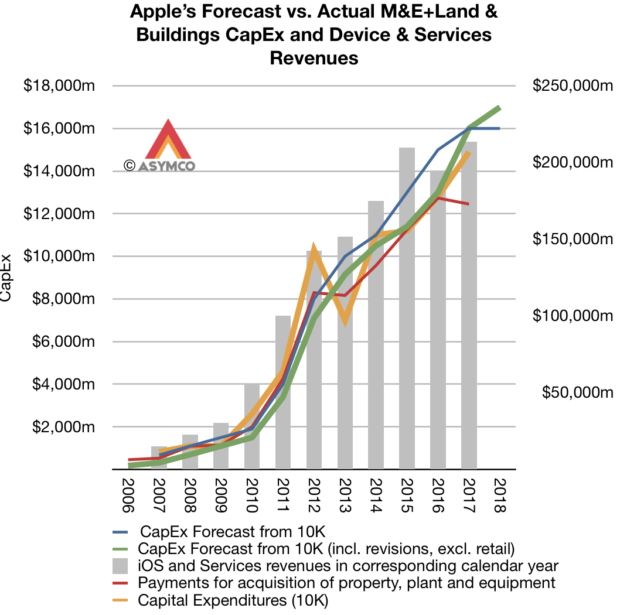
Minor2 differences, aside, this forecast and actual spending and payments data is significant because it is highly correlated to Apple’s overall business. Assuming that the spending on manufacturing equipment and information systems hardware (i.e. data centers) is in support of the iOS device sales and services we can try to show how sales correspond to spending with the following graph:

Here sales are shown as a bar graph and the various spending forecasts and actual payments are shown as lines. Also note that the spending and sales are offset by one quarter. The fiscal year is used for spending and the calendar year for sales. The reason is that spending is presumed to lead sales by approximately one quarter.
There are some notable discrepancies, especially with the 2012/2013 period when spending was brought forward a quarter thus showing a surplus to forecast in 2012 and a deficit in 2013. But apart from that, there is a broad correlation between spending and sales.
This means that the CapEx forecast in October is a good indicator of sales in the following year.
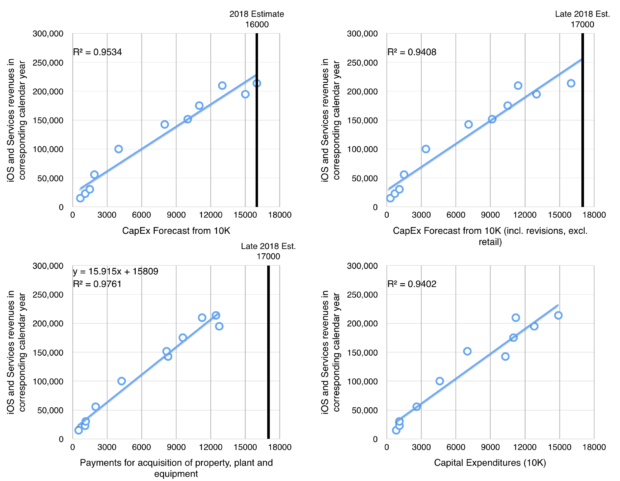
In fact, the relationship is can be shown with four scatter plots, one for each of the published figure:

I caution that this is a yearly forecast and it is revised through the year on a quarterly basis, sometimes up, sometimes down. It’s therefore not a perfect indicator and of course the relationship between sales and spending is not perfectly predictable. Note that there are four types of spending that can be measured, two are forecasts (one year and revised) and two are actuals (cash flow payments and reported total expenditures)
We can measure the best variable that fits the sales data through the coefficient of determination or R-squared. The best fit seems to be with Payments for acquisition of property, plant and equipment (R-squared of 0.976).
This gives the formula for yearly sales as 15.915x + 15809 where x is the expected total spending. That spending to date has been $10.272 billion and it’s probably going to exceed $16 billion for the year.
Using $16 billion spending total, we can calculate iOS products and services for calendar 2018 of $270.45 billion.
iOS and Services sales to date have been $103.2 billion with an estimate for next quarter of about 54.3 billion (based on guidance) and thus a total through Q3 of $157.5 billion. Subtracting this from the $270.45 billion expectation from the calculation above gives a fourth calendar quarter iOS revenue of $113 billion.
Adding $7 billion for the Mac results in a total net sales of 120billion. This therefore is what I’d put forward as a reasonable target for CQ4.
Note that this is equivalent to a growth of 36% from the 2017 fourth quarter.
[UPDATE: Original version used total sales rather than iOS related products and services (i.e. excluding Mac). The text has been edited to reflect the correct figures.]
