
It’s common knowledge that sell-side analyst price targets for stocks are not taken seriously. The evidence is simply that no public accounting exists for their historic performance. It would be trivial to grade performance but it seems nobody bothers to do it.
It seems strange given the attention paid and repetition of these targets in financial media. When a “note” is published with an opinion and a target price the stock price can and does actually react. But why should it if there is no accountability?
Well, not quite zero accountability. Philip Elmer-DeWitt publishes analyst estimates (example) diligently. These estimates are presumed to be 12 month targets, meaning that at the time when the estimate is published the target price is assume to be reached 12 months hence. He does grade the performance of these same analysts (and more) in predicting quarterly earnings and revenue estimates for the just-ended quarter.
But an estimate for what *just* happened in the last 90 days is a lot easier than predicting how markets will react to all the information about a company 12 months into the future.
So how hard can it be to measure performance on price targets vs. just-ended quarterly estimates?
Here is my modest attempt: I note that Apple’s share price today is trading around $298 per share. I also note that we can recover the estimates from analysts exactly a year ago. At that time Apple issued a rare warning that its own estimates for the fourth calendar quarter 2018, issued about 60 days earlier would be quite a bit different than what will be released (in 3 weeks).
This compelled all the analysts to re-set their targets at the same time. What we ended up is a whole batch of January 3rd 2019 estimates for, presumably, January 3rd 2020.
Well, January 3rd 2020 is tomorrow. How did the estimates hold up?
The following graph tells the story:
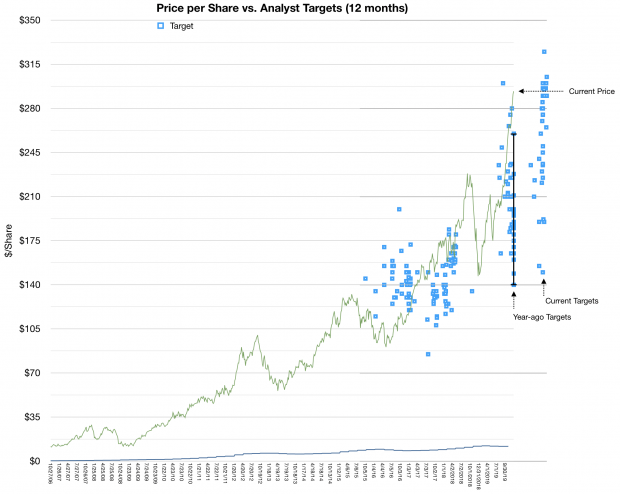
The green line in the graph represents the closing share price at weekly intervals (from about October 2016 until last week.) The blue dots represent various estimates. Note that they are 12 months since their issuance and that since estimates can come at any time the are not easily clustered.
That is except last year and the “big reset” when the estimates all were issued on the same day. I highlighted the range with a vertical line. Note that the closing price last week was well above the highest estimate and that the lowest estimate ($140 is less than 50% of the current price).
This is quite a big fail. Errors of 50 for a 12 month time frame are egregious.
A few additional observations:
The spread or variance of estimates is enormous. Far wider than what was the case 3 or 4 years ago. (I look forward to getting more data to perform this variance analysis). It’s peculiar to me that a larger, more stable business, as Apple is today, is more difficult to predict. To see even today a range in targets between $150 to $350 is bizarre.
Another observation is that very, very few targets were “accurate”. That is anywhere near what actually happened. To find these rare successes, look for blue dots placed directly or near the green line. The chances of a correct target is less than what can be attributed to chance. Again, I look forward to a larger data set to see if there is any set of analysts that perform particularly well or particularly poorly.
Again, we’re not describing here predictions about the stock market in general, or of macroeconomic indicators. We’re talking about predicting one single company’s stock price in a 12 month period. A company that receives a great deal of scrutiny and which publishes a surprisingly large amount of data about itself.
Now I don’t want to suggest that there is a better way to predict share prices. I will not try to do so because although it might be easy to predict earnings based on overall company strategy, processes and team (all well known) the share price is that data multiplied by a random number called “sentiment”. That sentiment can be summarized as the P/E ratio which wanders around aimlessly. I don’t think I have any way to predict sentiment one second into the future, never mind one year.
But even if I don’t think there is a method to the madness of sentiment, it seems dozens of people find it necessary to claim that there is one. But if you do, then analyze yourself. What did you learn from the mistakes? What is the theory you’re employing?
And if you don’t analyze yourself, then don’t expect to be taken seriously.