
In Google and Apple: The Beginning, we looked at the history of the relationship and the situation which emerged when Mobile Computing rose to such a level of ubiquity that it determined the fate of both companies. Apple today holds firmly in its grasp about 27% of all smartphone users (1.3 billion out of about 4.8 billion). That audience consists of the top quartile of users in terms of income, access to credit, consumption and loyalty. I performed a deep dive on newly available data which confirms that App Store users individually spend more than 7 times Play Store users.
Apple has over 1 billion customers but also they’re the best billion.
For this reason, Google has needed to ensure that it maintains access to Apple users for its main business: search. Just like any developer looking at iOS and Android ecosystems, Google knows that Apple’s customers are highly desirable, profitable and loyal. Apple had to remain a distribution partner for Google.
How to do that? Google distributors are incentivized with what Google calls TAC or traffic acquisition costs. This is how Google describes TAC in its 10Q filings:
TAC includes:
◦ Amounts paid to our distribution partners who make available our search access points and services. Our distribution partners include browser providers, mobile carriers, original equipment manufacturers, and software developers.
◦ Amounts paid to Google Network partners primarily for ads displayed on their properties.
Apple belongs to the first category, a distribution partner that is both a browser provider and OEM. These costs are part of Google’s “Cost of revenues” or Cost of Sales. These are costs that are proportional to sales and are usually measured as a percent of sales. The higher the sales, the higher the costs.
So the question that has been hovering over both companies for a long time is just how much is the portion of TAC allocated to Apple? Consequently, how much does Apple receive in such payments? This is a relevant figure as it affects the degree of co-dependency but also of relative profitability of each business. Apple gaining highly profitable commissions for access to its customers and Google getting highly profitable search terms from those same customers.
Here’s what we know: Google reports its overall TAC total as part of its cost of revenues and Apple reports its overall Services revenues and margins as a separate segment. Google also reports TAC as a cost against its Advertising segment revenues.
In the last quarter TAC was $12.6 billion, a 21.2% cost against an Advertising total of about $59.4 billion. Apple reports Services top line only without sub-segments so we don’t know how much of that TAC it receives. Services for Apple includes many elements including licensing, AppleCare, cloud subscriptions, digital content, third party subscriptions, apps, payment, advertising and other services. Some of these elements can be estimated as we have some historic data. Apps in particular can be teased out as we have developer payment data.
I’ve been estimating what would be Apple’s TAC+cloud+payments as a bundle over the years. Looking at this figure vs. what Google reports as TAC yields this graph:
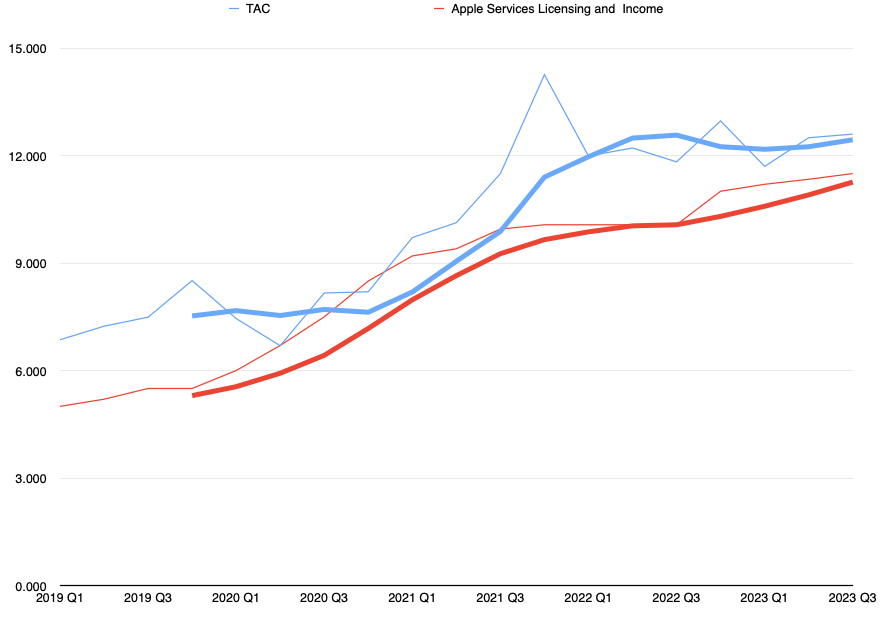
The thin lines are the actual data and the thick lines are 4 period averages. Apple is red, Google is Blue.
What this shows is that Google TAC is fairly well correlated to what Apple receives and that there is a gap of some degree. What is needed is an estimate of the percent of TAC that goes to Apple and a percent of Apple Services that matches it. Two variables but one equation.
After some iteration through some constraints (which would be laborious to explicate but I can reveal at the next live event) I built the following estimate:
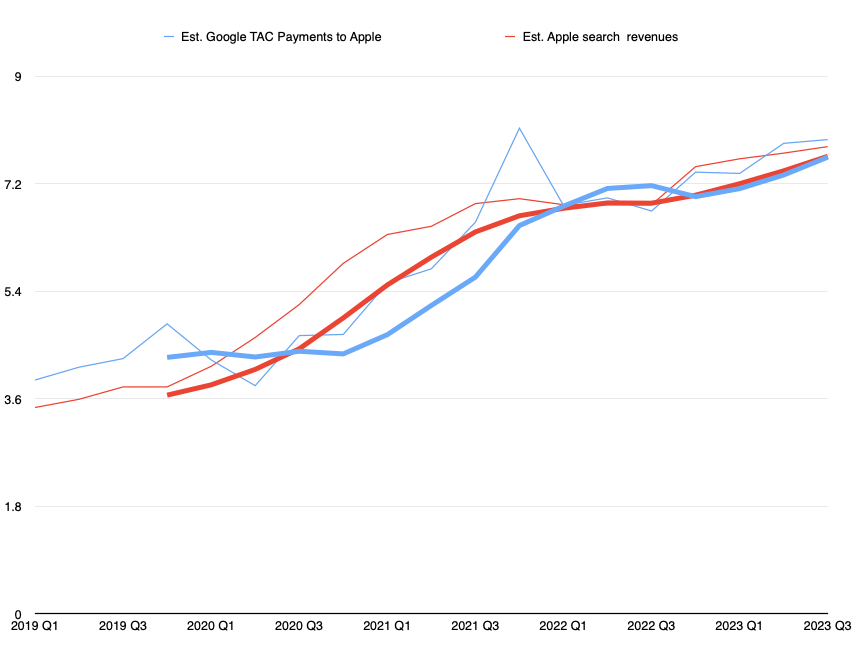
Though not matching identically, the yearly totals are pretty close to each other. The resulting yearly payments are
- 2019: $14.2 billion
- 2020: $18 billion
- 2021: $26 billion
- 2022: $28 billion
- 2023 (first 3 quarters): $23 billion
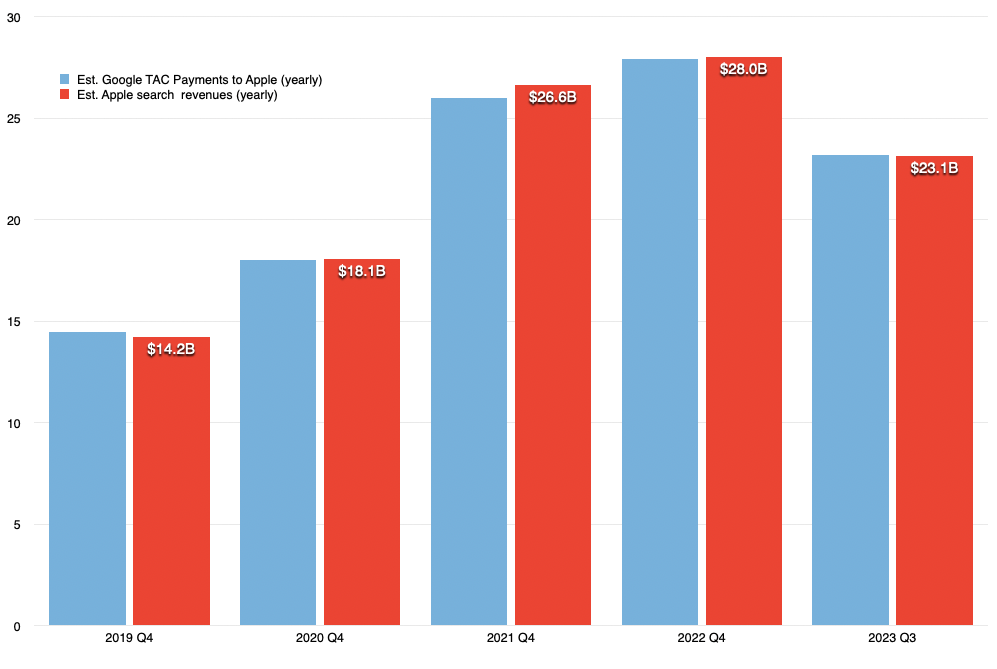
I would say this might be an upper bound for the estimate but not too far from reality. Most estimates to date have been far lower and I don’t think they are accurate.
To stress test this I ran several sanity tests including comparing the revenue per user for Apple users and for non-Apple users and checking the sensitivity of services gross margins to TAC total.
I’ll just expand a bit on the revenue per user implications. We can calculate the revenues per user since we know that, according to Google’s CEO, Apple receives 36% commission on search. Having the figures above, we can estimate the search income attributed to Apple and, by subtraction, the same for non-Apple. Then we can divide by the install base of each.
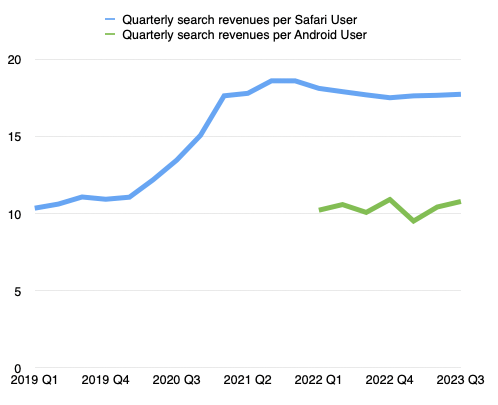
This shows that the deal could very well be indexed on the number of users with a specific value attached to each per quarter/month/day as these figures are fairly stable. The figure at this time shows that Apple users are valued at about $17.7/quarter or 19c/day while non-Apple users are around $10/quarter or 11c/day.
It also shows that Apple got “a raise” during 2021, increasing the amount it gets paid per user by about 60%.
It also suggests that Apple users generate about 37% of all of Google’s advertising revenue, disproportionately as it’s from a 27% user base market share.
None of these conclusions should seem surprising or extraordinary. If anything, they suggest that Apple is providing Google with bargain access to its customers. I suspect that Apple users are more valuable than a ratio of 2:1 in search. The app (and content and device ASP) economics are far more lopsided.
Apple is most certainly also very well aware of this and yet has maintained relatively modest pressure on Google in terms of pricing for access. There might be good reasons of which we are not aware of but as the antitrust pressure grows, so might Apple’s interest in getting a better deal.
In the next installment of this series we will look into just how much better this deal can get.
Discover more from Asymco
Subscribe to get the latest posts sent to your email.