I started working at The Clayton Christensen Institute and my job is to help develop the theory of disruptive innovation.
In order to do this I need to understand at least two concepts:
- The process of theory building
- Disruptive innovation theory
I’m more comfortable with the latter–having been a student (and victim) of it for more than a decade–but the the process of theory building is a new concept. At least to me but also, I believe, to many. The belief that a theory is fully cooked when first conceived is not the way science developed and the idea that business management theories are singular ideas rather than processes is symptomatic of an immaturity in the field.
So here are the basics of theory building as put forward by Clay Christensen and David Sundahl:
Definition: A theory is a statement of what causes what, and why, and under what circumstances. A theory can be a contingent statement or a proven statement. That is all.
Many managers shy away from using the word “theory” because it is associated with the term theoretical which suggests impractical. But managers use theory every day. They make decisions on some basis of cause and effect, often without being specific about their reasoning.
Process: First comes observation. Second, description. Third categorization. Fourth comes analysis and a statement of what causes what and why. This analysis can be simply an observation of a pattern or a more rigorous correlation analysis.
But that’s not the end of the process. The causal statement needs to be tested by predictions whose validity is tested with further observations and confirmation or denial of the statement. If the statement is denied we need to decide if it’s an anomaly that expands the theory or whether it contradicts the theory making it less useful.
The anomaly allows a new categorization to take shape. Getting the categories right is the key to the usefulness of the theory. The discovery of anomalies can thus make a theory stronger. The discovery of anomalous phenomena is the pivotal element in the process of building an improved theory.
This iteration between prediction/confirmation/anomaly handling can go for quite some time. As anomalies are accounted for on a regular basis then they can either be exhausted or depleted enough that a robust enough categorization emerges and the predictive power is nearly complete.
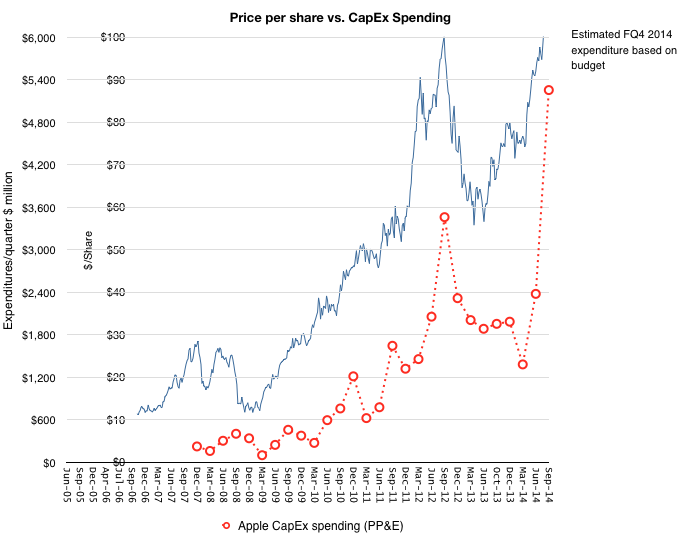
Example: In my reading of Apple’s financial statements I observed that Capital Expenditures were rising dramatically after the company began to sell iPhones. The observations were made over a few years. The pattern observed showed some correlation between spending and shipments of units.
The company’s spending was then compared with a group of other technology companies. These observations suggested that spending varied according to business model and strategy and that Apple seemed to be transitioning from one type of spending (on infrastructure) to another (on manufacturing equipment.)
Then a statement was made that Apple was using capital expenditures to not only ensure supply of components but also of component manufacturing equipment. This was borne of necessity but had the side effect of creating competitive advantage as its unibody devices and Macs were unique and differentiated.
As the more data came in, by the prediction was made that capital expenditures– which are incurred before production starts and which are pre-announced on a fiscal year basis — indicate new product ramps or new product introductions.
A few anomalies were experienced when spending increased but production didn’t and vice versa. These were studied and explained by shifts in technology (mainly screens) which required “out-of-phase” investment. Additionally, the companies in the cohort also varied their spending on the basis of opportunities in the short term.
As it stands, the theory that Apple uses capital investment in tooling to manage its quality and quantity of production and that in doing so it integrates deeply into its supply chain creating competitive lock-outs is holding up. It is not sufficiently precise to forecast actual production volumes for individual product lines but the growth in the business is broadly foretold by the growth in capital expenditures.
Indeed the share price generally reflects this:
Proposition: At a basic (micro) level, the process of theory building is something we do instinctively. We observe patterns, make statements that A causes B and carry on with the theory as an assumption. The challenge is more on a macro level. Few theories are built rigorously about the causes of success or failure of business systems. This includes understanding why large, powerful firms fail when confronted with small, weak competitors. Why, how and when industries disappear. How resources are allocated and how priorities are set. It’s as if individuals behave with far more intuitive insight than firms.
That is what must change.
Because firms are increasingly determining the prosperity and sustainability of nations and the world. We can’t afford mismanagement.
The counter-point to this quest is that large systems are intractable and business is inherently chaotic, unpredictable. It may be, but much of what we know as science today was once thought of as impossibly mysterious and unknowable. I have faith that as the physical universe, the affairs of men have laws which govern them.