
A transcontinental journey, WWDC and listener questions.
Source: The Critical Path #153
A transcontinental journey, WWDC and listener questions.
Source: The Critical Path #153
ComScore suggests that there are 100 million tablet owners in the US. On a per capita basis that implies penetration of about 30%. As a percent of mobile phone subscribers (above age of 13) that implies 40%. As a percent of smartphone users that implies 43%. As a percent of iPhone users that represents 47%. As a percent of households assuming one device per household that implies 85% penetration. By another measure (Pew) household penetration is around 50%.
Regardless of the difficulty in defining what is the correct “addressable market”, the more important question is whether tablets will be an ubiquitous object. Perhaps what we are seeing in the US is something similar to the MP3 player market or video game console markets where penetration saturated at around 50%. Perhaps tablets will reach PC levels which are closer to 80% of population or perhaps they will reach phone levels which are above 90%. The reason we can’t answer the question of ubiquity easily is because competing solutions can carve the usage out of a category “disrupting” it with alternatives.
The idea that jobs are the segments into which products fit and not demographics or product attributes is key to understanding this migration. The reason phones have subsumed more jobs onto themselves is because they have a rapid rate of evolution and because they have larger scale of economy and because they are conformable to our life spaces. As phones get better they take on more jobs and some of those jobs are those of tablets. The MP3 did not become ubiquitous because the phone took its job. Same for the video game and same perhaps for the PC and tablet.
At the 2015 WWDC Apple stated that it receives 5 billion requests per week for its maps service. It also said that Apple maps is used 3.5 times more frequently than “the next leading maps app.”
These two data points are the total number of data points we have about the global maps market. Neither Google nor Nokia provide usage or share or performance data. Regardless, commentary on the usage, share and performance of Apple Maps has been abundant for the three years since its inception.
The data presented allows us to make a few estimates for the first time and we can hope that additional data can allow a picture to emerge of where maps are going.
With these first two data points we can finally make some estimates. But some assumptions are still needed: We need to assume that the “next leading maps app” is Google Maps. Although there are other maps apps on the iOS platform they are probably insignificant and it’s a two-horse race between Google and Apple on iOS.
This means that the 3.5:1 split in usage results in a 78% share for Apple Maps and a 22% share for Google. If we assume that there are about 400 million iOS users of maps1, it leads to about 90 million Google Maps users on iOS and about 310 million Apple Maps users on iOS. This includes iPad.2
Given that Google also reported 1 billion downloads in 20143 we can assume between 25% to 33% Apple Maps “market share” of usage.
Horace talks about Jony Ive’s promotion and answers listener questions on everything from Apple TV to the need for companies to “have children”.
Source: The Critical Path #152
Horace and Anders discuss Comcast, cable companies and lowest common denominator content on television screens everywhere. After the break, Horace takes listener questions from Twitter.
Source: The Critical Path #151
To the analyst, the car industry is a wonderful study. Unlike some other “high technologies,” whose market births and deaths are separated by a few changes of the seasons the automobile industry has been around for well over a century. It has been sustained through dozens, perhaps hundreds of innovations. Almost everything about the car of a century ago has been improved.
Not only improvements to the product itself but improvements to the infrastructure that supports it: roads, gas stations, services, insurance, regulation. At the same time, its numbers have increased steadily as the car has spread to all corners of the world through waves of increased production and distribution. Although invented in Europe, the production system that allowed it to reach the mass market took hold in the US. That production system was then exported to Europe then to Japan and then to Korea and now to China. 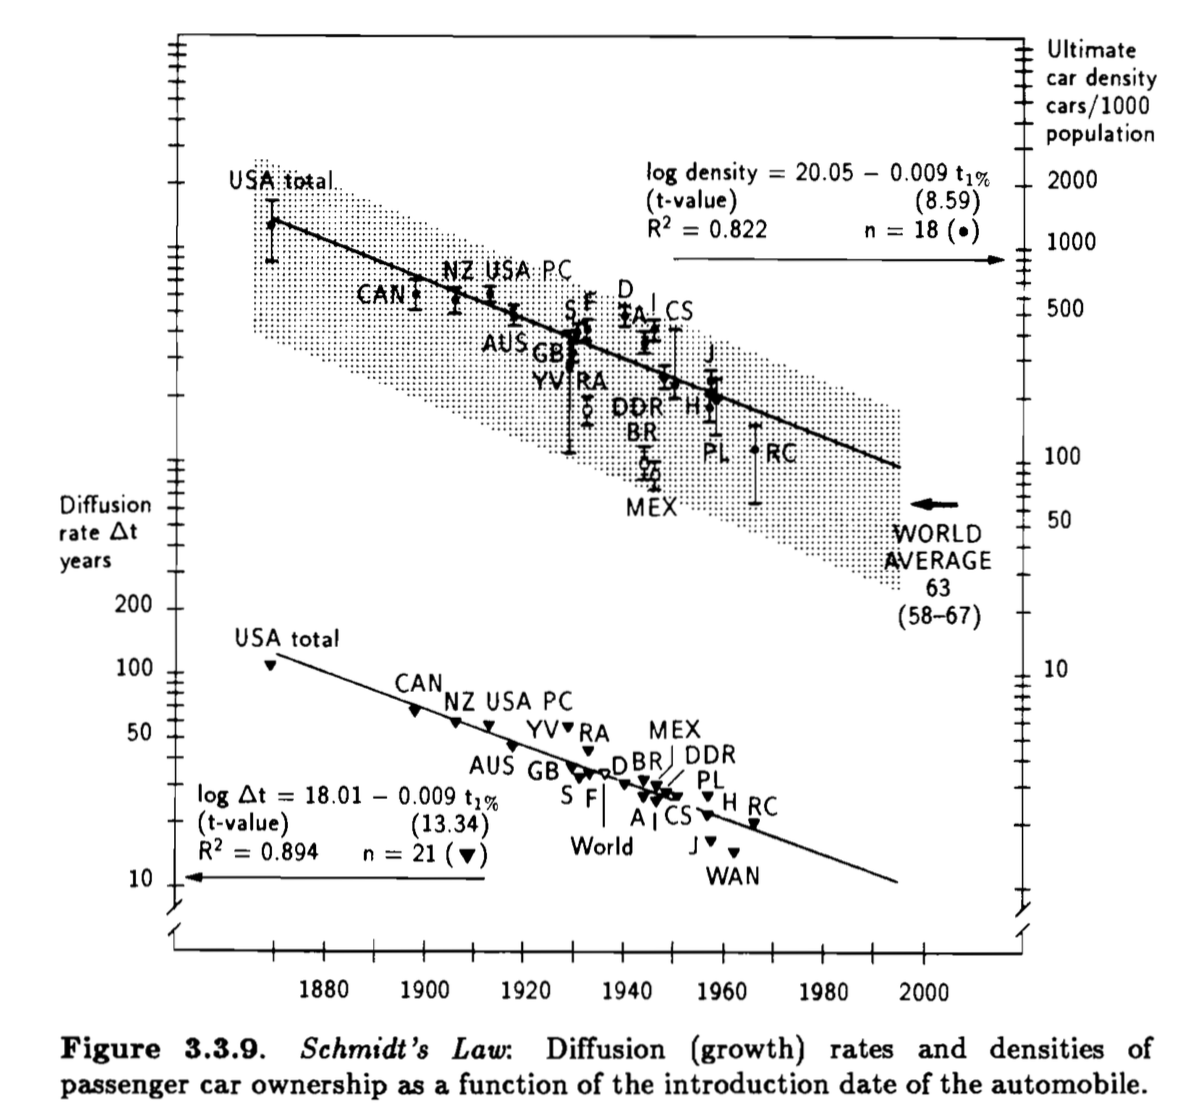
Figures 3.3.9 and 3.3.10 from Arnulf Grubler’s The Rise and Fall of Infrastructures
However, throughout this century of improvement, the business structure—the way money is made—has not changed. Even with the arrival of Volkswagen in the 1960s and Japanese automakers in the 80s, the network of incumbents has not been displaced. Newcomers have taken share, but there have been few exits suggesting that classical disruption has not taken place.
When we look at the reasons for the share displacement that did take place, we see innovation in production systems and distribution as the core causes. We see new manufacturing processes and competition against non-consumption. What we don’t see is new technologies. We don’t see diesel engines or anti-lock braking or crumple zones or fuel injection or radial tires or airbags or automatic transmission or air conditioning or electronic ignition or safety glass, or any of the other hundreds of technologies that have been adopted as causing any change in market share.
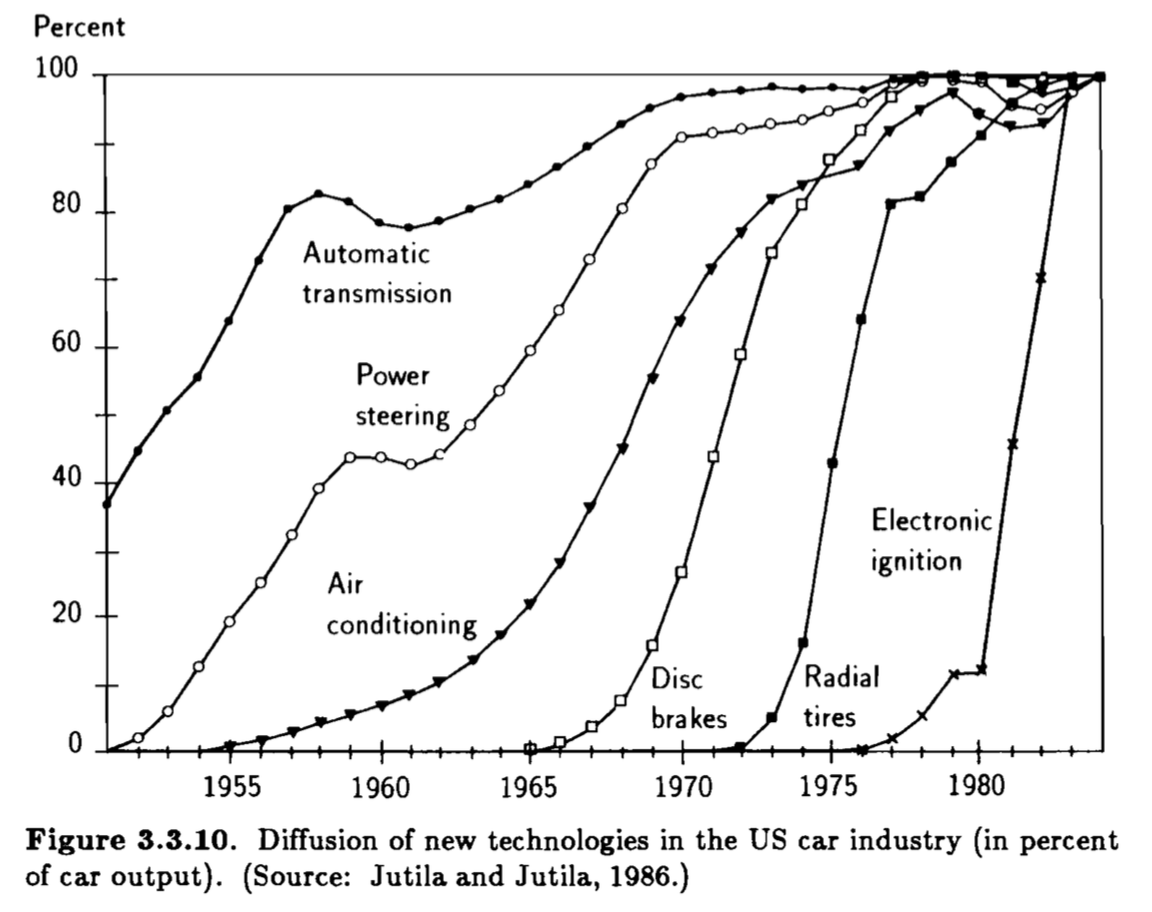
Every innovation tends to diffuse rapidly throughout the industry, being widely adopted by all manufacturers. Production systems such as the ones from Ford and Toyota have been much slower to be adopted which has offered those innovators an advantage for a few decades, but they too have eventually been widely copied and created normative behavior. The opening of new markets like Asia, Eastern Europe, Latin America, Africa and China have created opportunities for local manufacturers but eventually those advantages too have or will be diminished with time.
So, given this, we have to ask if the the availability of new power storage technologies would allow an early mover to displace and move aside these established makers. To answer in the positive would imply that the challenger has an asymmetric business model—one which causes the incumbents to flee in the opposite direction. But Tesla is manufacturing cars using the same JIT processes and ramping quite slowly. Toyota-style process-driven innovation does not seem to be even in the works. There is no shortage of manufacturing capacity, indeed there is too much.
Furthermore, Tesla is selling cars in established markets competing against existing consumption. Volkswagen Beetle or Model T style competition against non-consumption does not appear to be on offer.
Tesla’s product introduction rate is relatively sedate, so a higher rate of product development which might let them “turn inside” the incumbents, does not seem likely.
Finally Tesla is introducing products priced well above average appealing to the wealthiest of customers, again causing us to ask how this might cause a luxury company to look at their solution and exclaim “Not for us!”.
Looking from every angle I am unable to find the way that Tesla is asymmetric. Disruption theory suggests that whatever causes it to survive or prosper will be embraced and extended by competitors precisely because it will also cause those competitors to survive and prosper.
The auto industry may be a lot slower than the computer industry to respond. But once the industry embraces battery-based power, it will convert a world-wide production and distribution system to sustain itself.
That does not mean Tesla is a bad business. They may carry on with Porsche-like or even BMW volumes for a long time. But that’s not a disruptive outcome, it’s a niche strategy.
There is one more point. As Tesla has chosen to share its intellectual property and as Elon Musk has stated publicly, they welcome others to build the same cars they do. So by their own admission the company does not seek to disrupt. Disruption is a competitive stance.
In the last and final part of the trilogy, Horace discussed the Japanese automotive industry, and provided interesting insights into how Japanese car culture contrasts against the European and US counterparts. Using the innovator’s stopwatch framework, Horace explained the challenges on how Tesla, Google, Uber and Amazon could disrupt the car industry, and provide some thoughts on what approach Apple might take on creating the car if they are doing it
We know how many iPhones Apple ships but we don’t know exactly how many of each model. We can try to come close in such estimates of “mix” by looking also at the market pricing of the phones and the average price Apple obtains1
Combining what we know with some guesses allows some of us to estimate the composition of iPhone models in any given quarter’s sales. Here is a graph showing my estimates:
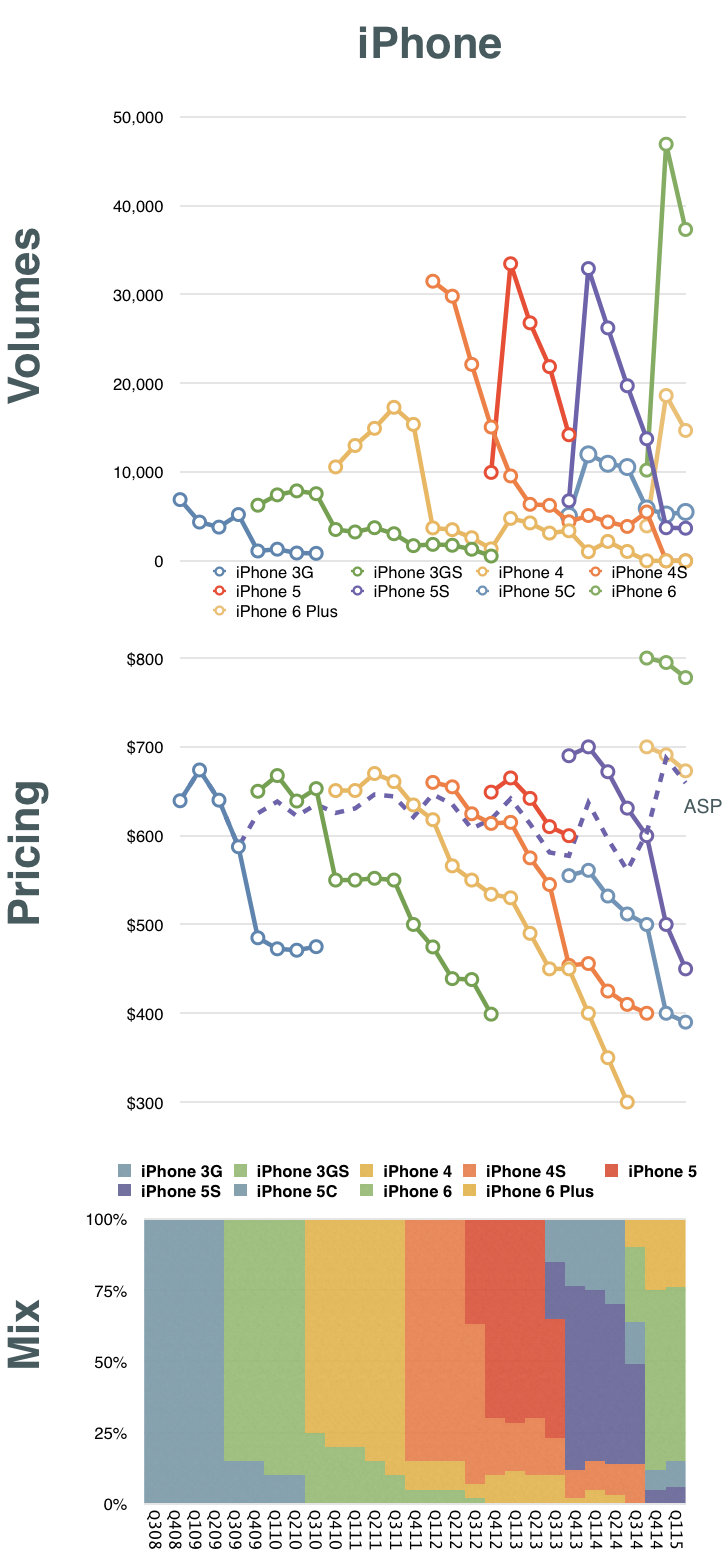
Having this, we can then assess how each generation of iPhones has performed. Remember that although we had a new iPhone for each of the last eight years, there are only 5 generations in total. Starting with the 3G (second generation) the generations were two yearly product cycles long.
The resulting estimates for generational growth are shown below. Continue reading “Schiller’s Law”
Horace Dediu, current research fellow of the Clayton Christensen Institute and founder of Asymco.com joined us for an epic and insightful discussion focusing on few key interesting topics: (a) new market disruption theories, (B) Apple in China and the luxury market and (c) the Japanese automotive industry and how it shapes up against disruption from Tesla, Uber and Apple. In the first of the trilogy, Horace discussed the origins of Asymco.com and also why he has used Apple as the lens to understand innovation and technology disruption. We also traced back to other Apple-like companies in the past such as Sony in Asia, and look at how Apple and Pixar has displayed a different kind of “DNA” against innovative companies in the past. Last but not least, we discussed the evolution and future of Google and where it might lead them to.
Listen to it here.
Unicorns typically are valued on the basis of number of users. While they are not yet monetizing those users, their growth and engagement metrics are expected to be off the charts. As there are no revenues (or profits) the $billion valuation hinges on a nominal value of $/user. That figure is based on comparable companies (e.g. Facebook) which do monetize their users.
Since the unicorn’s capitalization/user defines its valuation, which company should be considered comparable? Unfortunately they range widely. There are many alternatives. The graph below shows a few Market Cap/Mobile User rates ranging from $45 for Yelp to $747 for Alibaba.
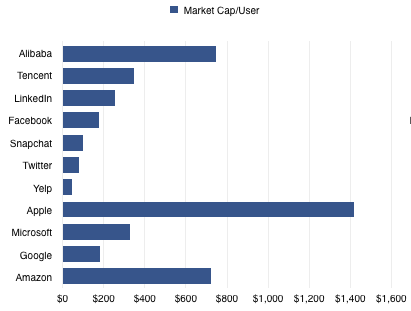
Note that I’ve also added companies which may not be considered as unicorn comparables because they are not usually valued on a per-user basis. Apple, Microsoft, Google and Amazon are priced by product sales, typically. However, most of them operate and self-define as service organizations. Microsoft has been “monetizing users” for decades using a recurring revenue model. It has a “SaaS” business logic for most of its revenues. Google1 likewise. Amazon reports its active users every quarter and obviously is measuring itself by that metric.
Apple2 is the least likely to be seen as a company whose value is a function of user base. Nonetheless it behaves entirely on that basis. The company’s entire strategy depends on satisfying its customers and building its brand which can only have one outcome: loyalty and repeat purchases. The services and software they offer can be seen as supporting that brand loyalty which is converted to profit through an above-average selling price.
Being mature of business model therefore does not exclude a company from being valued like all the kids are these days.
So, if we do look at the value/user metric we might as well look at the revenues, operating profit and growth data. Continue reading “Unicornia”