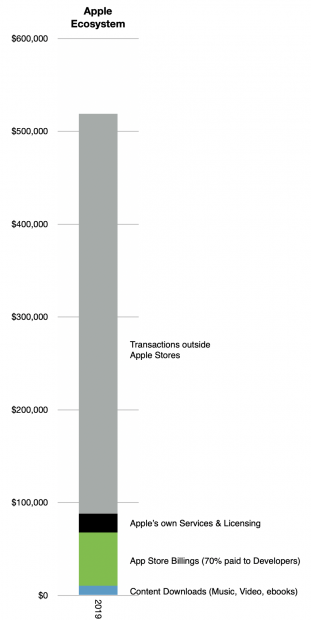
According to one estimate, in 2019 Apple’s ecosystem was approximately $519 billion. This includes both transactions that Apple handles, such as paid apps, as well as purchases and other economic activity that happened through apps in which Apple is not involved in the transaction, such as Uber, Bird or Bond rides.
A fraction ($48 billion or 9.3%) of this total is reported as part of Apple’s financial statements as “Services Revenues”. The rest ($471 billion) is reported on other financial statements, typically businesses which use apps to book sales. These are app revenues are not even accounted as “Payments to Developers” as they are not paid directly to any developer.
The attention to Apple’s terms and conditions with developers only apply to transactions in the area shown in green below. The grey area is all outside the App Stores and attracts no attention.
The attention paid to Apple’s new services including the “+” brands of TV, News, Arcade, Music and now Fitness and the new bundling thereof refers to the area shown in black above.
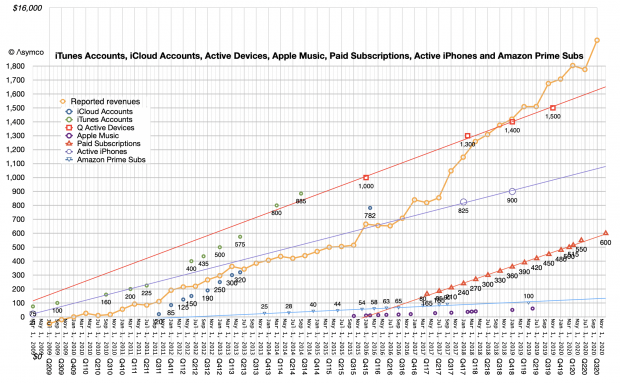
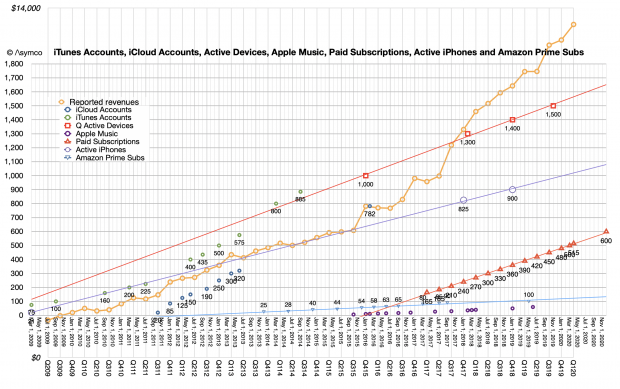
The Green and Black areas are also captured through subscriptions whose quantity is charted with triangles below. Note that the latest quarter saw an acceleration in the accumulation of subscriptions, putting the 600 million target set for end of this year closer than expected. Note also the change in slope of the yellow line as the triangles were added.
These two charts are an attempt to illustrate what is a huge set of activities. Apple’s product lines may be something we can grasp in terms of objects for sale and price points, and feature sets, etc. But the Ecosystem that sits on top of these devices is not comprehensible.
There are literally millions of apps, services, and ways of delivering and capturing value. There are millions of people employed in what amounts to an economy bigger than the 25th largest in the world (Belgium (1)). It’s half a trillion dollars of activity.
Given the growth of the underlying Services segment (~15%), it’s probably going to double in 5 years to $1 trillion. Apple will certainly benefit as even if only 9% of that is booked as direct revenues, the rest will create resilience in the user base.
The power of an ecosystem isn’t what Apple is able to skim from it but rather that millions of other people will want to encourage and preserve its existence as their livelihoods, hopes and aspirations will depend on it. This goes beyond loyalty of end users (which is extraordinary) as it’s a loyalty of those who co-invest in it. All participants in an ecosystem become partners in its preservation.
Apple is not the only technological ecosystem out there, but I’m willing to bet that it’s the most vibrant in terms of creative effort, economic value and growth.
This ecosystem is a thunderous declaration of value which is largely unheard by investors or analysts. While looking at the potential for growing the direct revenue with “+” Apple services, the indirect, qualitative added value of services which never hit Apple’s income statement are ignored. Like the ignored value of a satisfied customer, how much is the value of an economic co-dependency?
Although it’s inappropriate to compare a company’s market capitalization (which is a measure of asset value) with GDP (which is a measure of economic activity) an “economy” like the value of all transactions in an ecosystem is comparable with GDP.
The latest Apple Watch has a blood oxygen sensor which measures the wearer’s oxygen saturation (SpO2). Oxygen saturation is the fraction of oxygen-saturated hemoglobin relative to total hemoglobins in the blood. If the level is below 90% it is considered low and is very dangerous. An alert is issued in that case.
The Watch also monitors (periodically but consistently) the wearer’s heart rate and can warn of abnormal rates. It can also detect patterns of irregular heart rhythms and atrial fibrillation.
The Watch can also provide VO2 max or the maximum rate of oxygen consumption measured during exercise. This measurement provides a quantitative value of endurance fitness and reflects cardiorespiratory fitness.
The Watch can also generate an ECG or electro cardiogram which is a graph of voltage versus time of the electrical activity of the heart using electrodes placed on the skin. The ECG can be generated as a PDF and sent to a physician for analysis.
The Watch also monitors sound levels providing a warning of when the wearer is exposed to dangerous sound levels and should consider protecting their hearing.
The Watch can also detect a fall and summon emergency services even if the wearer is unconscious. It can also be used to summon assistance with a push of a button.
The Watch uses machine learning to track sleep and can monitor the vital signs listed above during that time.
The Watch has an always-on altimeter which is working to help with tracking effort by the wearer.
The Watch can detect hand washing and provide a timer so you do it well enough.
The Watch can track all physical activity and provide motivational reminders to meet daily goals.
The Watch can monitor exercise with precision and provide data that helps you improve your performance.
The Watch can also be used to pay for your groceries at the register.
The reason the Watch can do all these things is because it’s a computer. A computer with a dual core processor based on the A13 bionic chip also used in the iPhone 11, a retina display that is always on(!) and displaying at least 500nits at all times. It has on-board storage for music, WiFi, Bluetooth and a touch screen.
But although being a computer allows the Watch to do all this and more, no PC can do even one of these things. Nor does a PC have GPS, or Cellular connectivity or NFC and is certainly not swimproof. You don’t wear a PC in bed and it does not stay with you 24×7.
The Watch is among a class of devices that have emerged less than five years ago that do many things that PCs can’t. They also do many things phones can’t.
Biometric sensing (SpO2, ECG, Afib detect, sleep tracking, fall detection, etc.) were not features that were even requested from phones or PCs (or tablets.) Nor did PC users ask for iPhone or tablet features like taking selfies, gesture-based gaming and Lidar.
The Watch has taken on the job of health monitor and health preserver. It isn’t a job any other computer would have even attempted.
The story of phones, tablets and wearables is a story of creating new markets, not substituting for old ones. In so doing the new markets are greater than their putative substitutions would allow. This is happening over and over again but it still seems to go largely unnoticed. Keep an eye out for a lot more of this.
The iPad was launched in April 2010, about three years after the iPhone. Followers of the company will know however that the iPad was designed first, starting sometime in the early 2000s.
The iPad was the prototype touch device because it’s less constrained but also because Apple was, at its heart, a computer company and the iPad was a computer first, device second.
Concepts of tablets predated Apple’s entry and go back to the 1990s. The idea of a “Tablet Computer” was envisioned by Alan Kay as the Dynabook as early as 1968. He famously remarked that if Apple were to build a tablet-sized iPhone it would “rule the world“.
But has the iPad come to rule the world?
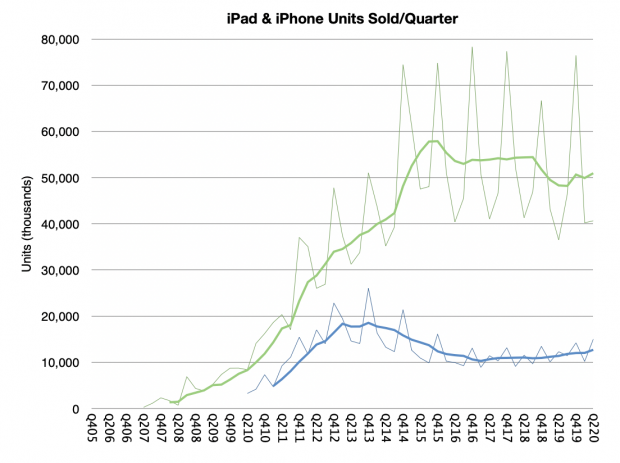
Ten years is not a long time—the Mac is now 36 and it’s still kicking, Windows is only 25 years old—but already 500 million iPads have been sold.
The sales history of the iPad in units is shown below in blue vs. the iPhone in green. (Note, values in last 8 quarters are estimated).
The story that did not pan out for the iPad is that the unit growth did not match that of the iPhone, which, in its first decade sold 1.2 billion units.
But that is because the iPhone and iPad differ in significant ways. Ways which were difficult to anticipate early on.
Difficult because internally the two are basically the same. Both share the same processors and architecture and (until recently) the operating system and user interaction model. They have a similar “bill of materials” (though prices are quite different, with iPhones typically more expensive.)
The main difference has been in the display size. As I noted early on, a few inches of display may not look like a big difference but it is qualitatively very different—as much as a bathtub and a swimming pool both contain water, the quantity of water changes dramatically what you can do with either.
As a result of its size, the iPad is more likely to remain at home; not stationary in one spot, but not “in-hand” at all times. That affects how long it lasts and the tasks it’s assigned to do.
As a result, iPads stay in use longer, get passed on to new users and serve for many years. Their average life span is likely well over 4 years and 9 year old iPads are not uncommon. It’s therefore very likely that the vast majority of all iPads sold are still in use.
So the true measure of success is not units sold but number of active (and satisfied) users. The iPad user base is probably around 400 million (about 27% of total active Apple devices.) The degree of activity is also telling and is reflected in the million apps built specifically for the platform.
400 million users makes for a healthy ecosystem, especially as the users tend to be willing to spend on apps and services, which in turn, attracts more investment from developers, which leads to more usage, and so on, in a virtuous cycle.
As with all aspects of Apple analysis, the qualitative is just as important as the quantitative, even more so. The quality of the users, the usage and the product is the pre-eminent assessment.
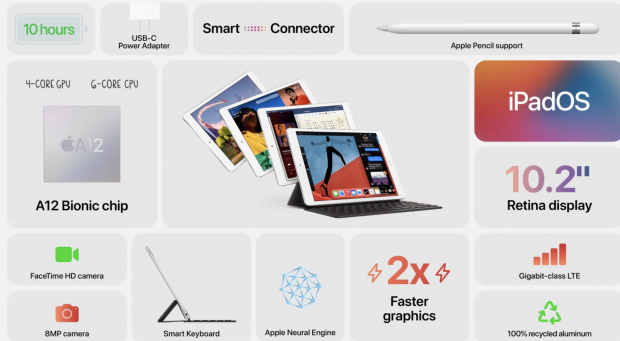
iPad users, usage and product make for a remarkable combination. On the product side, the Fall 2020 line-up is another leap forward. In particular, the price points, breadth of offering, accessories (mini, Air, Pro, pencil, Smart Keyboard, etc.) and the power across the board.
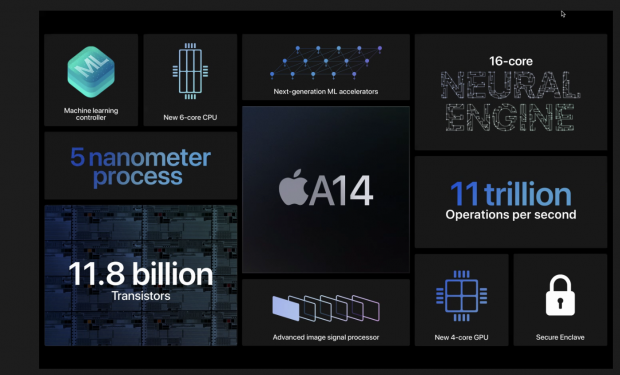
This year sees a performance jump in the middle of the line-up with the usual mind-boggling measurements (some beginning with “nano,” and others with “tera”.)
So where to for iPad now? What worlds remain for it to conquer? So far has found users in the three “E”s: Enterprise, Education and Entertainment. Pro usage is a niche that is growing in production, especially media. What many might say is that it needs to aim at replacing the laptop, or the PC in general.
It has not done that so far, much to the delight of naysayers. But this is not as big a failure as it might seem.
First note that the Mac user base itself is not nearly as big (110 million +/-10%). iPad could be 4x bigger in user base. The Windows base is larger at 1.2 to 1.4 billion but that resists frontal assault as it is deeply entrenched around enterprise workflows. It’s also bereft of profit.
What iPad did do is create its own demand. It sits comfortably aside other platforms not in place of them. Most iPad users also have an iPhone and a PC or a Mac. I happen to have all those and more than one iPad. The iPad did something grander than kick the PC off its perch. It sat next to it and found life quite comfortable.
In March 2016 Ben Bajarin and I put on an event called SUBSCRIBE where we asked, among other things,
How will the online services business models evolve?
How will hardware affect software and services and vice versa?
How will users, usage, and capital connect?
Now is a good time to look back on that event.
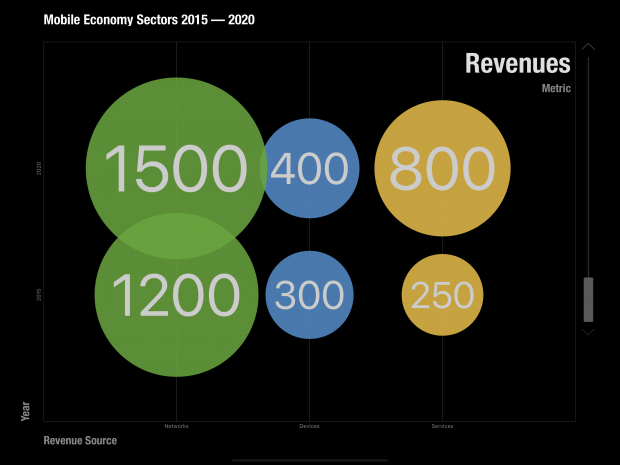
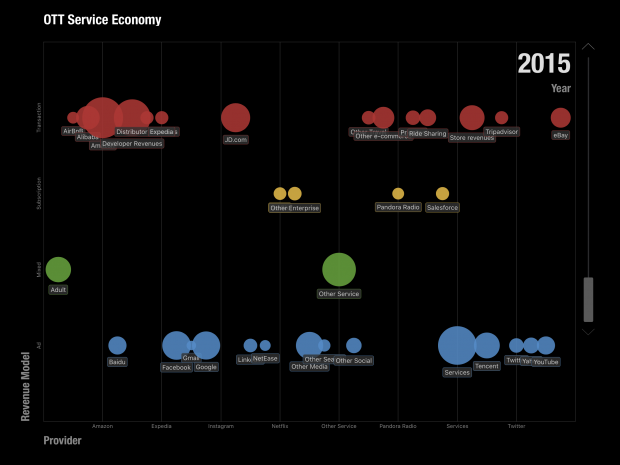
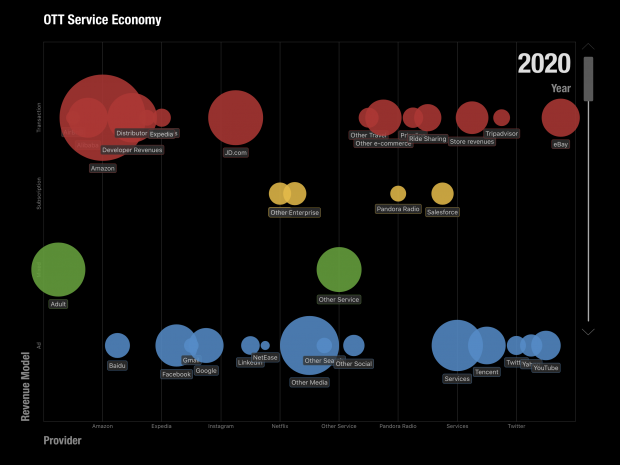
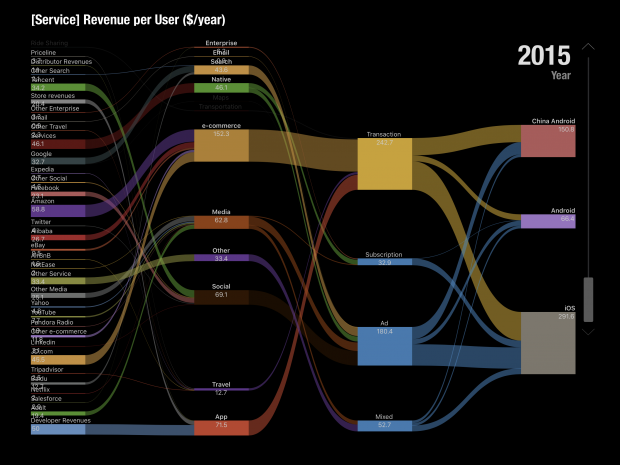
For the keynote I prepared a model which predicted the mobile ecosystems for iOS, Android and Chinese Android over the next 5 years (to 2020). The methodology involved taking a measurement of the revenues of the top internet service companies, building up the categories these companies occupied, estimating how much of those revenues are through mobile distribution and then splitting the result among the three platforms of iOS and the two Androids.
Adding to that the “native” app and content revenues for each platform would yield the Ecosystem total value. Applying a growth rate would offer some visibility into the future.
The following images are screen captures of the Perspective presentation.
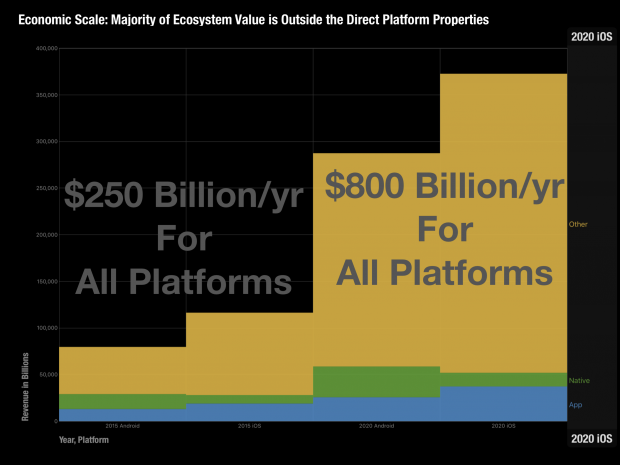
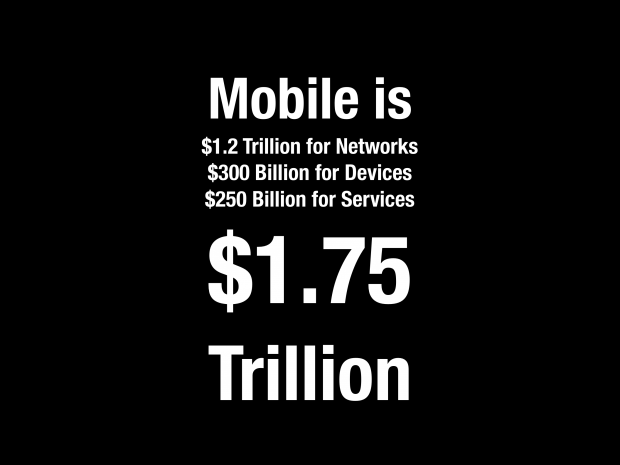
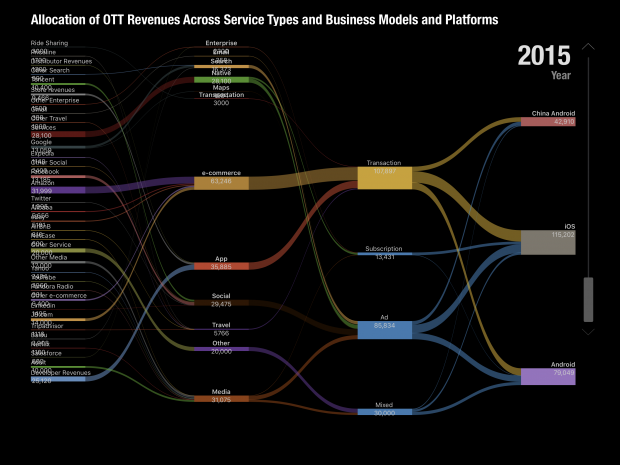
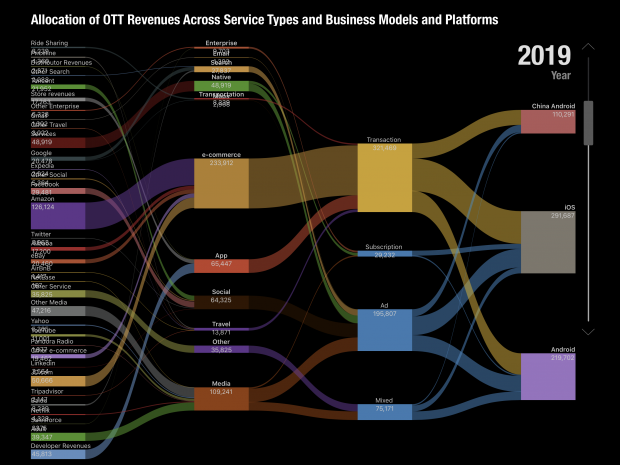
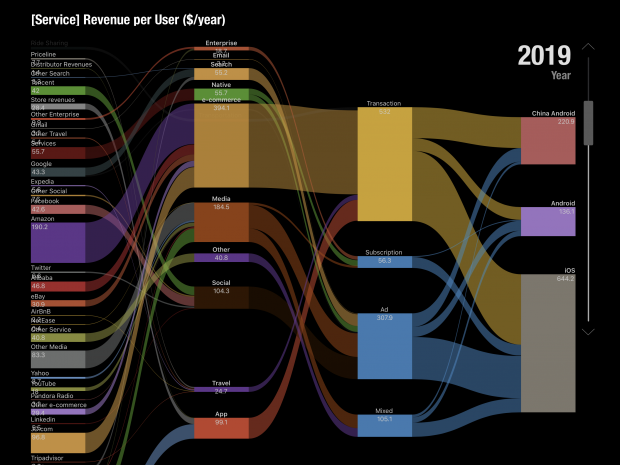
Revenues across Networks, Devices and Services 2015 to 2020 (estimated March 2016)Operating Income across Networks, Devices and Services 2015 to 2020 (estimated March 2016)Ecosystem composition (Third Party App, Native Apps, Other) 2015 to 2020, Android vs. iOS.Estimated mobile ecosystems total value by 2020 estimated in 2016.Over the top (OTT) service components by revenue model in 2015 estimated in 2016.Over the top (OTT) service components by revenue model in 2020 estimated in 2016.Allocation of OTT Revenues Across Service Types and Business Models and Platforms 2015 (estimated in 2016)Allocation of OTT Revenues Across Service Types and Business Models and Platforms 2019 (estimated in 2016)Composition of service revenues per user ($/year) for mobile platforms in 2015 (estimated in 2016)Composition of service revenues per user ($/year) for mobile platforms in 2020 (estimated in 2016)
Of course there are several potential errors in this methodology. The categories were not all inclusive. I used Social, Media, Search, Maps, email, Messaging, e-commerce, Travel, Enterprise, Storage, Transportation, Travel and Other as the top level categories. There are many products and services who would end up in Other. Moreover, these categories were anchored by the top companies in each category and the share of the top names was not always clear. Finally, the growth rates for these categories were based on historic trends which could change either way.
The online services ecosystem (all platforms) was thus estimated to be $450 billion in 2015, growing to $820 billion by 2019 and $914 billion by 2020.
The mobile split would vary by segment but would be roughly 75% by 2020 (25% would not be mobile). The final assumption was based on the split among the existing mobile platforms. I put a multiple of roughly 50% for iOS and 35% for Google Android and the rest for China Android.
Multiplying all these assumptions gave me a figure of $275 billion for the iOS portion of the global online services market in 2019. (Incidentally, Android was estimated at $207 billion and China Android $110 billion.) Note that this does not mean this was an expectation of Apple’s revenues or that this was the opportunity of Apple obtaining any percentage of this revenue. It was simply the value of what would transact through iOS, a platform which would act as a commerce enabler. This was to be the size of the iOS “ecosystem” or co-dependency between Apple and the companies delivering through its platform.
Ecosystems are a powerful idea. As I recall, this term applied to mobile was coined by a Palm executive in the late 1990s when he referred to the value of all the apps built for the Palm Pilot. The biological term refers to the system of multiple species living in close proximity. It implies an equilibrium as each species benefits from the others and the environment. There might be predators and prey but biodiversity is the successful construct.
The idea of an ecosystem for a platform was also the core strength of Microsoft’s Windows which created the network effects around it and it has been the goal of every platform since. The nature of computing and networking implies that these systems grow faster and are more resilient than the more traditional value networks of other businesses or industries.
Now this ecosystem was something we wished to highlight in 2016 as a core strength for Apple. It was not considered as such at the time and I thought putting a figure of $275 billion in 4 years’ time was a way to highlight the potential. Time since has proven us right.
This week Apple highlighted the result of another research team who attempted to measure the iOS ecosystem. Their conclusion was that billings and sales facilitated by the Apple App Store Ecosystem in 2019 was $519 billion. More than twice the amount I had so optimistically forecast four years earlier.
The authors also emphasize that this is a conservative estimate and should serve as a baseline.
I feel partly vindicated about that figure as my attempt at a figure was intended to highlight the scope of the ecosystem and it is better to have underestimated it than overestimated it. The authors’ methodology was also similar in being bottom-up summation of components by categories of services but the information available today is enhanced by the new data Apple made available on subs and Services revenues and install base.
Note that in the graph below the salient data points of subscribers (red triangles) had not begun until 2017 causing the acceleration in Services revenue (yellow line). Note also the additional square points representing install base.
This figure of more than half a trillion dollars of value transacted through iOS should give some pause. It it a very powerful figure that can be combined with the other data from Apple:
More than 1.5 billion active devices
More than 1 billion iPhone users
More than 500 million paid subscriptions
More than $1/day iPhone hardware revenues for Apple
The half-trillion per year on services implies between $335 and $520 in spending per user (likely closer to $500) per year. This would be in addition to the approximately $365/yr in hardware spending per user (which Apple books as hardware revenue). In the case of the iPhone there is yet more: the cellular network service which may average $350 per year.
To simplify, the “average Apple user” spends $1/day for each device, $1/day for the network and $1.4/day on items bought through the device. Adding a margin of error, that’s between $3.4 and $4 per day each user spends. Oh, and there are about a billion such users.
The total spending enabled by iOS thus is close to $1.4 trillion/yr.
That’s a significant amount. It’s bigger than many industries. There are only about 12 countries with higher GDP (Spain is about the same.)
How does Apple benefit from this?
Apple captures 30% of billings through its App Store. My estimate for these billings were $67.9 billion in 2019 which means App Store billings were 13% of the 2019 ecosystem. Apple’s 30% cut of Billings amounts to 3.8% for the whole ecosystem. It’s hardly an oppressive number.
If Apple only captures 3.8% what use is this to Apple?
The last decade has seen Apple emerge as the world’s largest company in terms of market capitalization, and not doing so with a wild multiple of revenue or earnings, quite the opposite. It did this by creating the world’s greatest customer base. Not in absolute scale. Android and Facebook have larger customer bases with multiple billions of users.
No, Apple’s one billion users are simply the best billion users. They are the most likely to stick with Apple and they are the most likely to buy more from Apple and—this is crucial—they are the most likely to buy everything else. Those other companies whose sales come from Apple customers have been taking note. They know that Apple customers are desirable customers and choose to target Apple customers, as much as they can. Associating your company with Apple makes a lot of economic sense.
I will admit however that my argument that Apple created a customer base is contrived. The fact is that Apple creates productsand services and those products are the root of its power to attract the right customers. By choosing to create the best products it coincidentally chooses to create the best customers. The power flows from product not from pricing or positioning. This is a lesson lost for many.
Developers and regulators might feel Apple’s massive power is perhaps too much. In the last decade, the narration around Apple has shifted from Apple being perpetually “doomed” to it being too dominant. Although I’m sure there are some who will try to conflate the two declaring that dominance will inevitably result in doom, most critics of Apple went from laughing (at it) to crying (about its practices).
The argument that Apple should change its practices developed to price as it does, distribute as it does or design as it does because it was too successful or is “unfair” is getting the causality wrong. Dominance won’t be altered by a few points of percentage change (on a tiny fraction of ecosystem transactions). Fairness won’t be altered when there are thousands of business models and many remain to be invented. Case in point is pornography which is not permitted on the App Store but which exists in abundance thorough other access methods.
The argument is that Apple should be more generous. That it should decrease the “cut” it takes for distribution. Or that it should not enforce revenue split for the customers it exposes to others.
But this is problematic on many levels. The playing field for all developers needs to be level. The customer must be respected and access to that customer should be constrained or certainly metered. Abuses must be policed and that requires leverage.
These practices are inter-dependent and the effect multiplicative, not additive. Apple has a monopoly on iOS and on MacOS and WatchOS and iPadOS. It does this to control the experience, security and safety of the user. It’s that control which created the customer in the first place. It should naturally control access to its hard-earned customers.
It does not monetize the distribution of content or apps unless the developer/creator directly charges for the product or service. Distribution is not cost free and to offer it for free is a subsidy which would create additional market and innovation disincentives. The loyalty of Apple users is evidenced by the 600 million paid subscriptions (end of year estimate) that are booked through the App Store. Developers benefit directly as a result.
One could argue that the abundance of services which don’t distribute through the App Store is evidence that the system works as intended. Apple’s App store front is its property and it reflects its core values.
Being on the shelf in the App Store means you operate on the terms of the shelf owner. If the rules are not agreeable then the half trillion dollars of ecosystem activity is testament to the availability of alternatives.
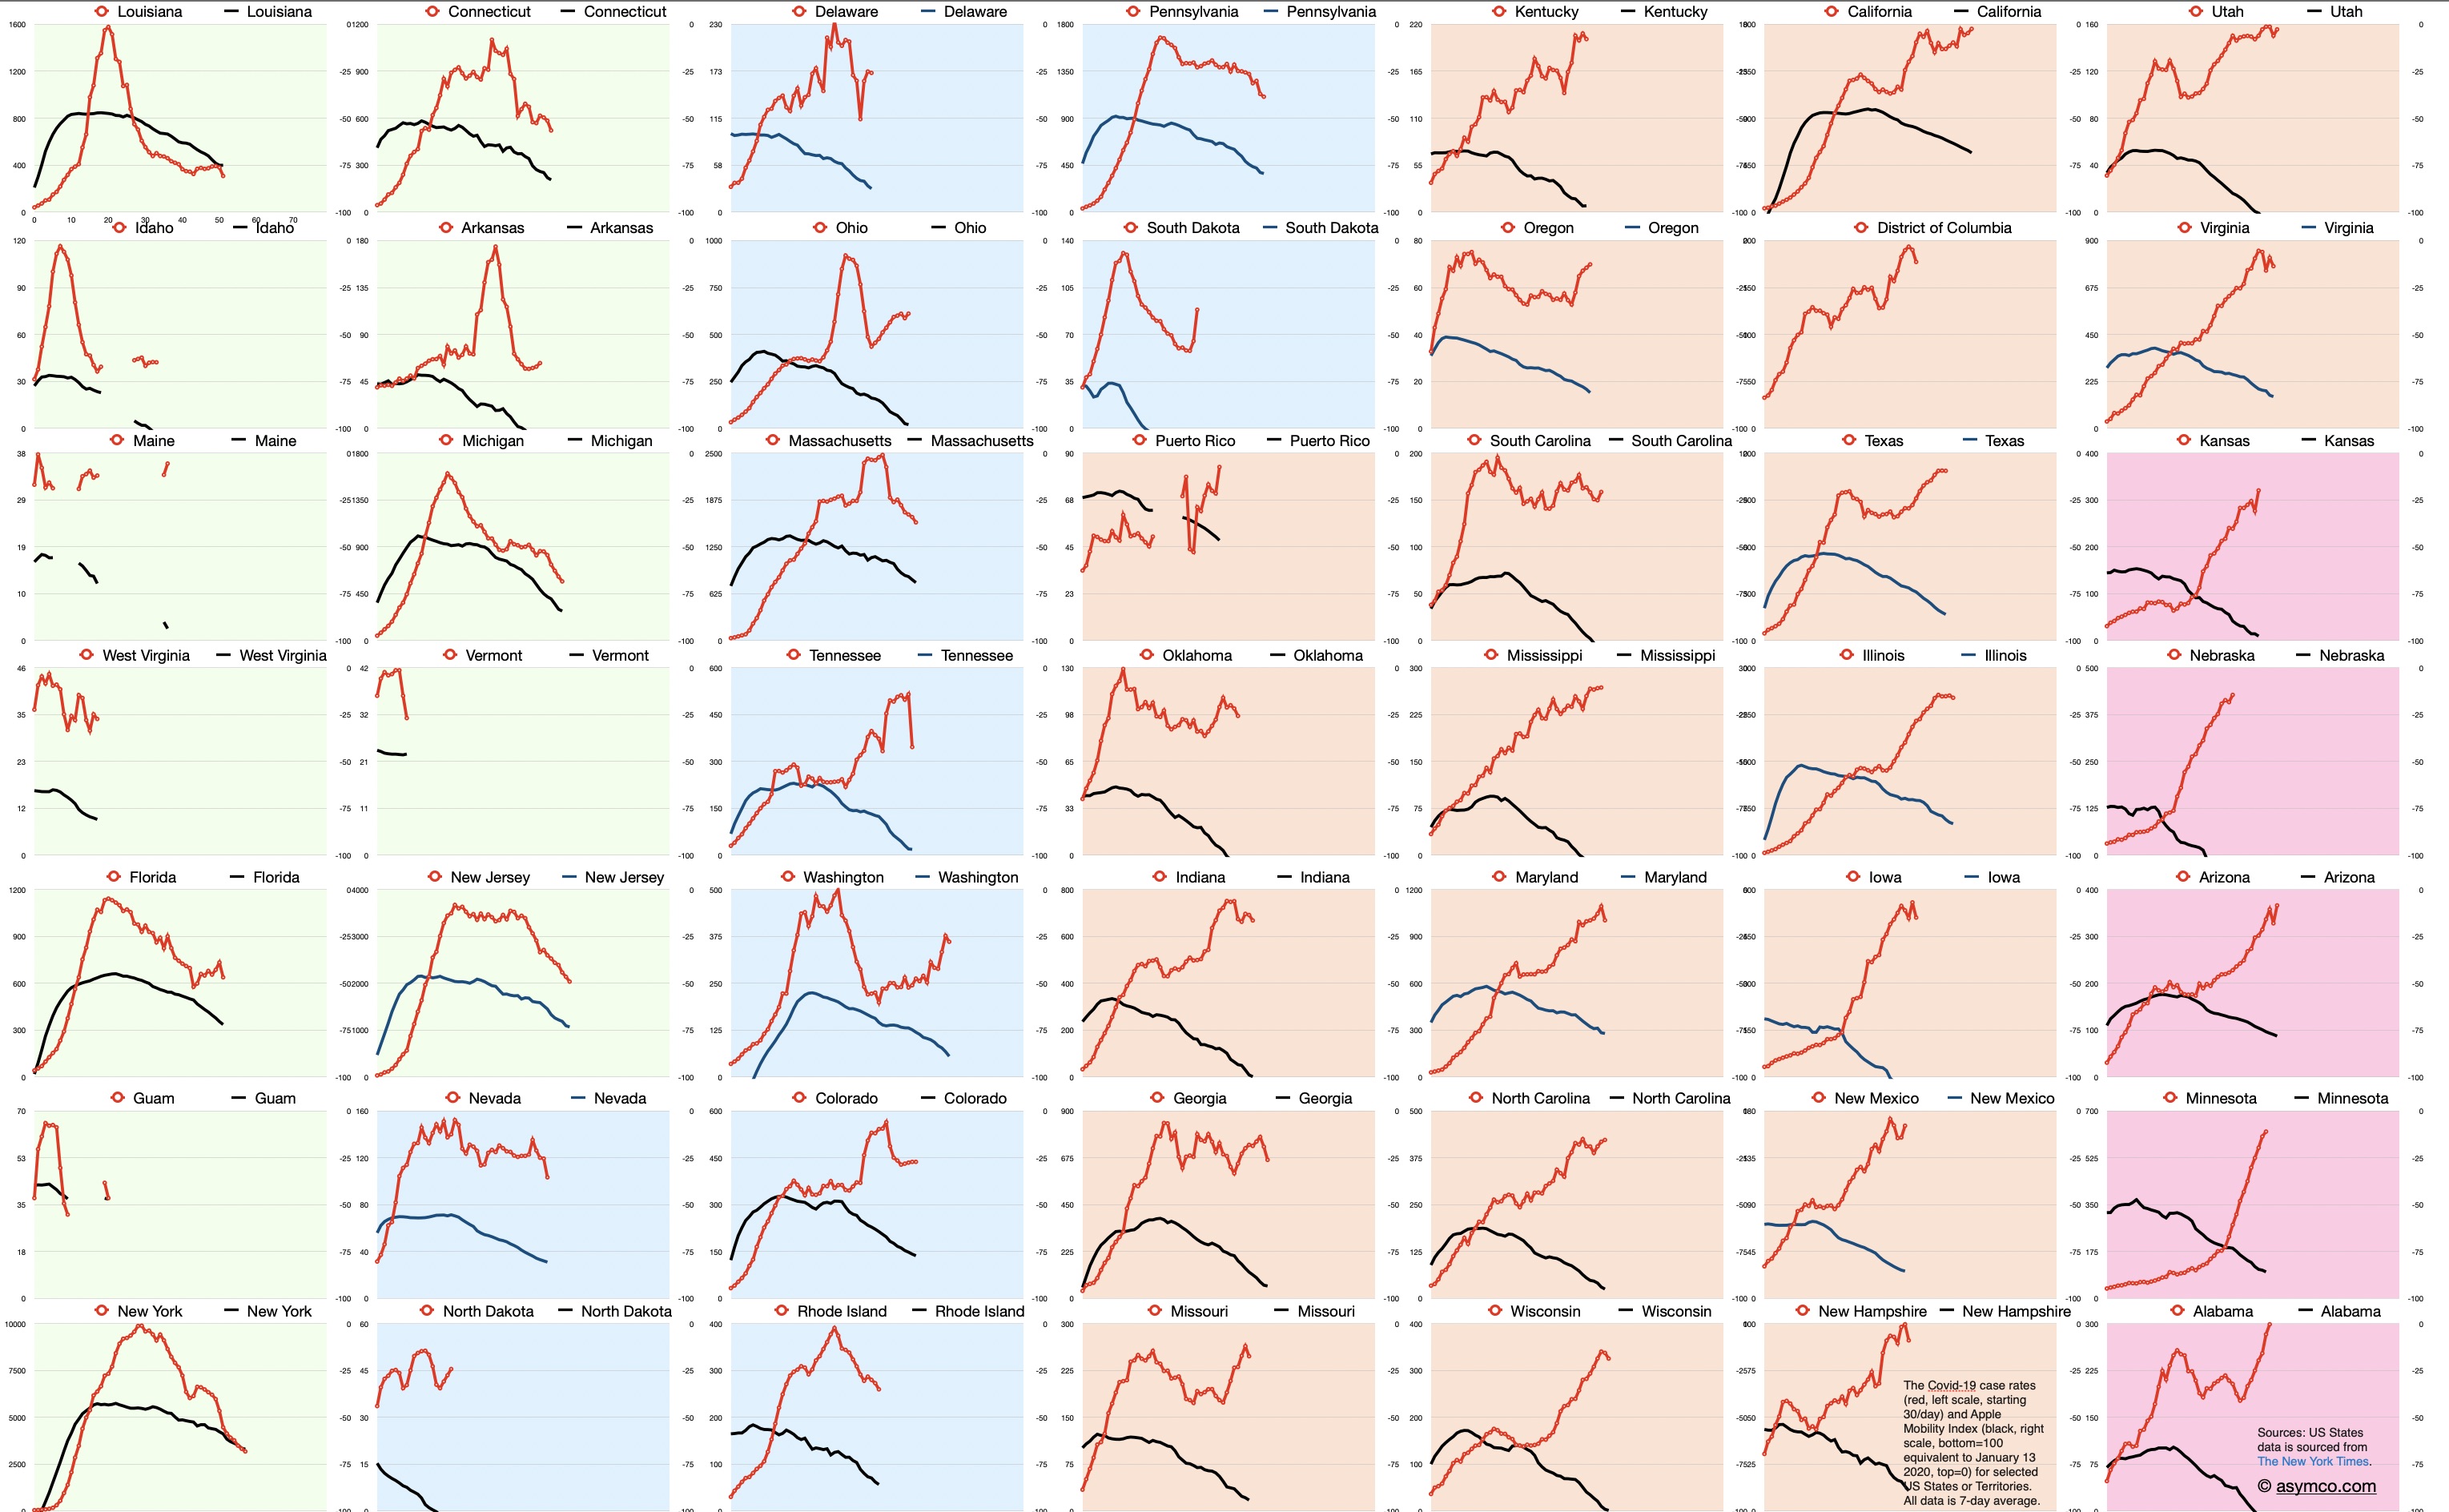
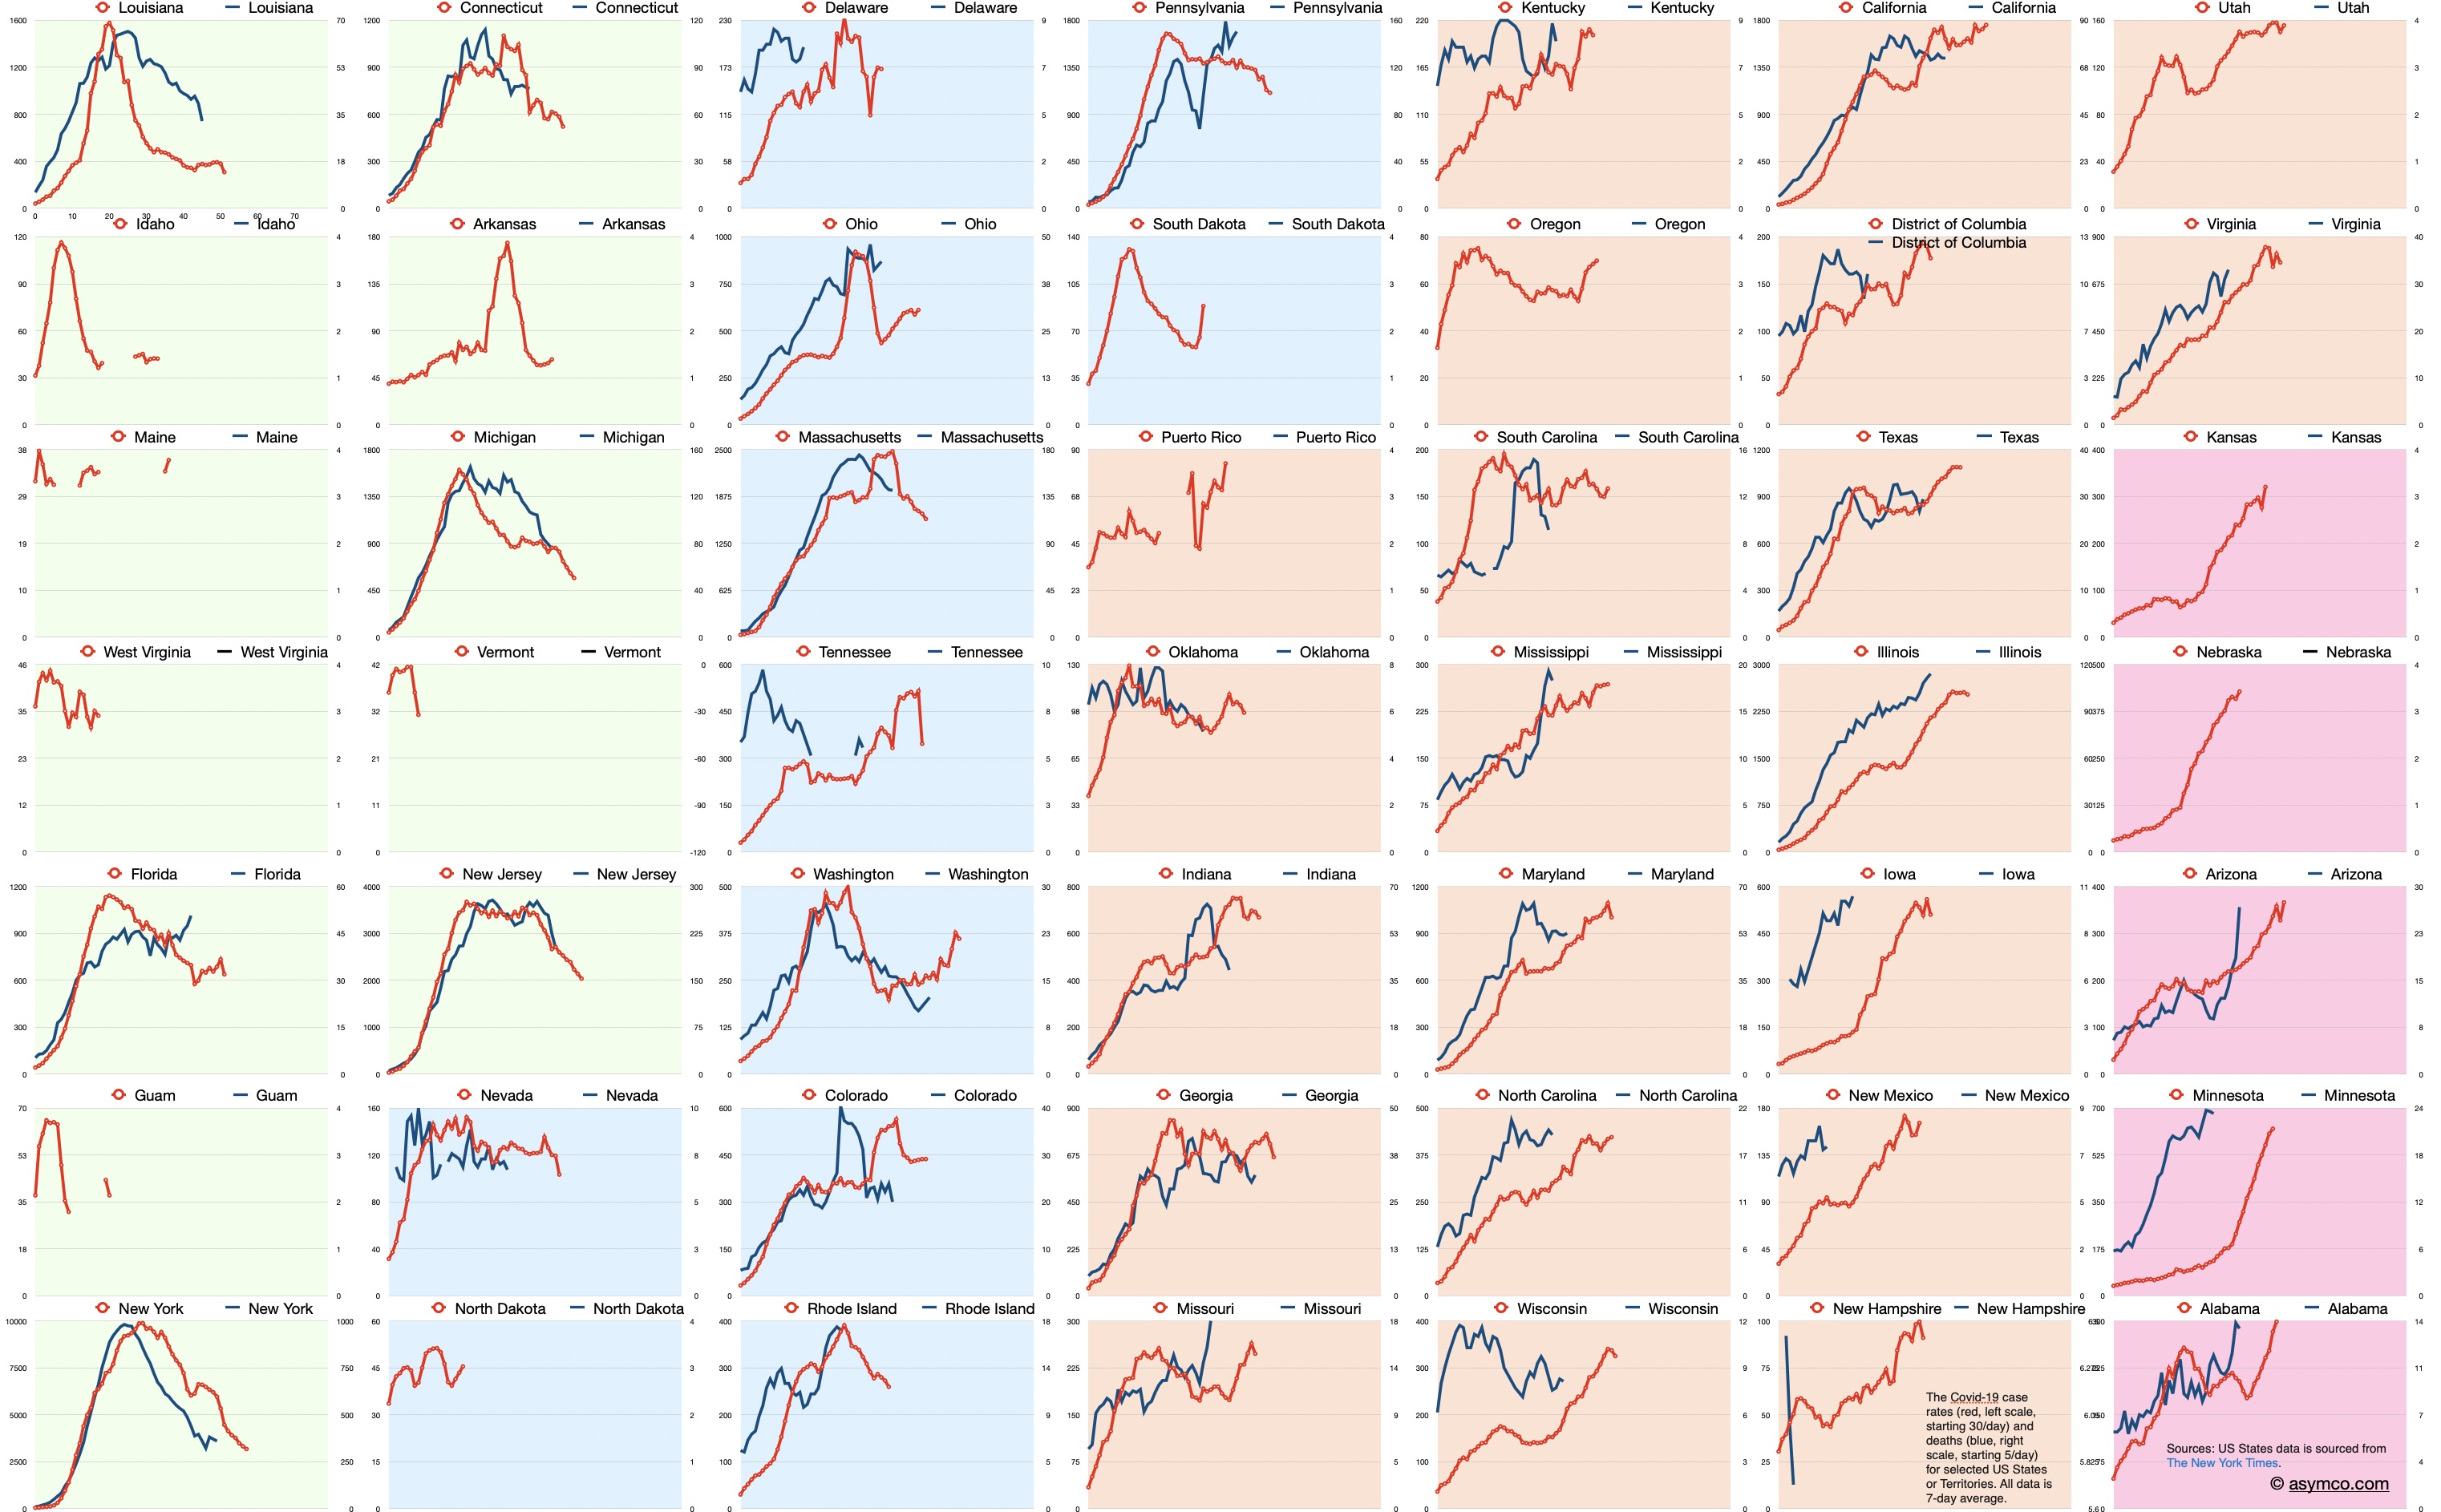
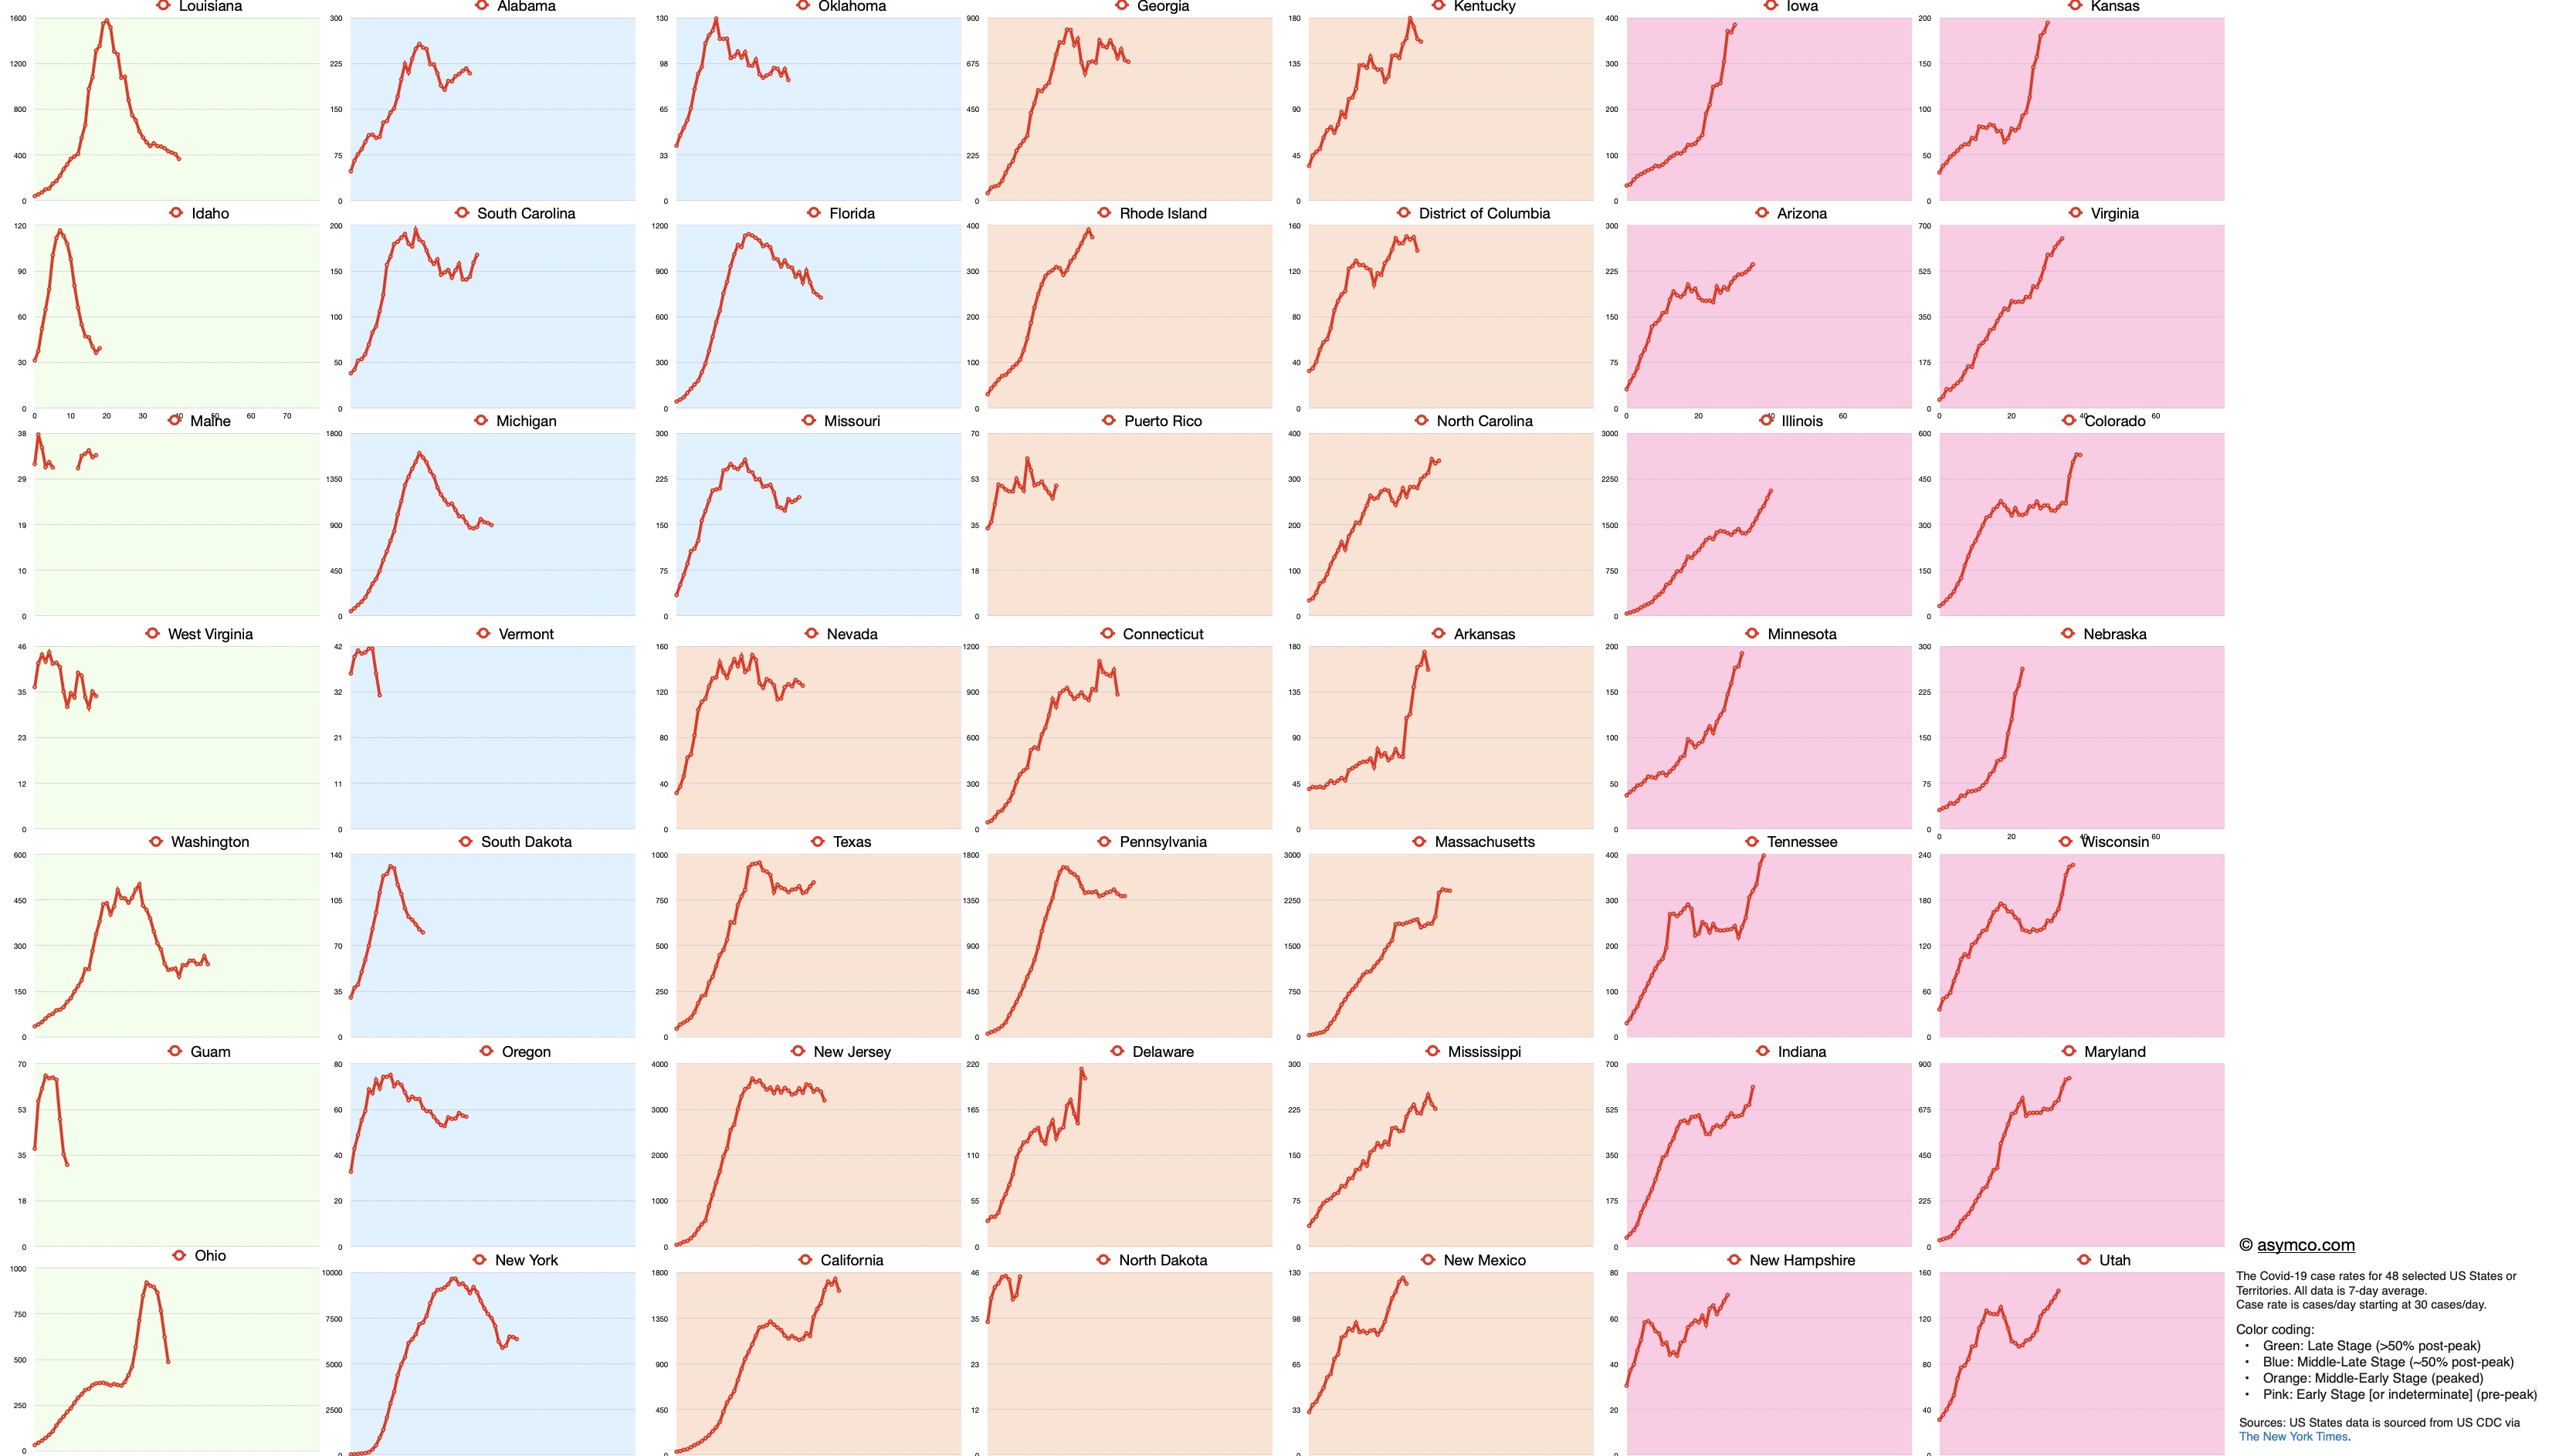
The Covid-19 case rates for selected US States or Territories including Apple Mobility Trend.
Red line is case rate in cases/day starting at 30 cases/day, left scale. Black line is stringency index (inverse of Apple Mobility Trend, right scale. All points are 7-day averages. Click on image for higher resolution or download.
The Covid-19 case rates for selected US States or Territories including deaths/day data. Note that the two curves are not for the same dates but are offset in time to start from 30 cases/day over a 7 day average and 5 deaths/day over a 7 day average.
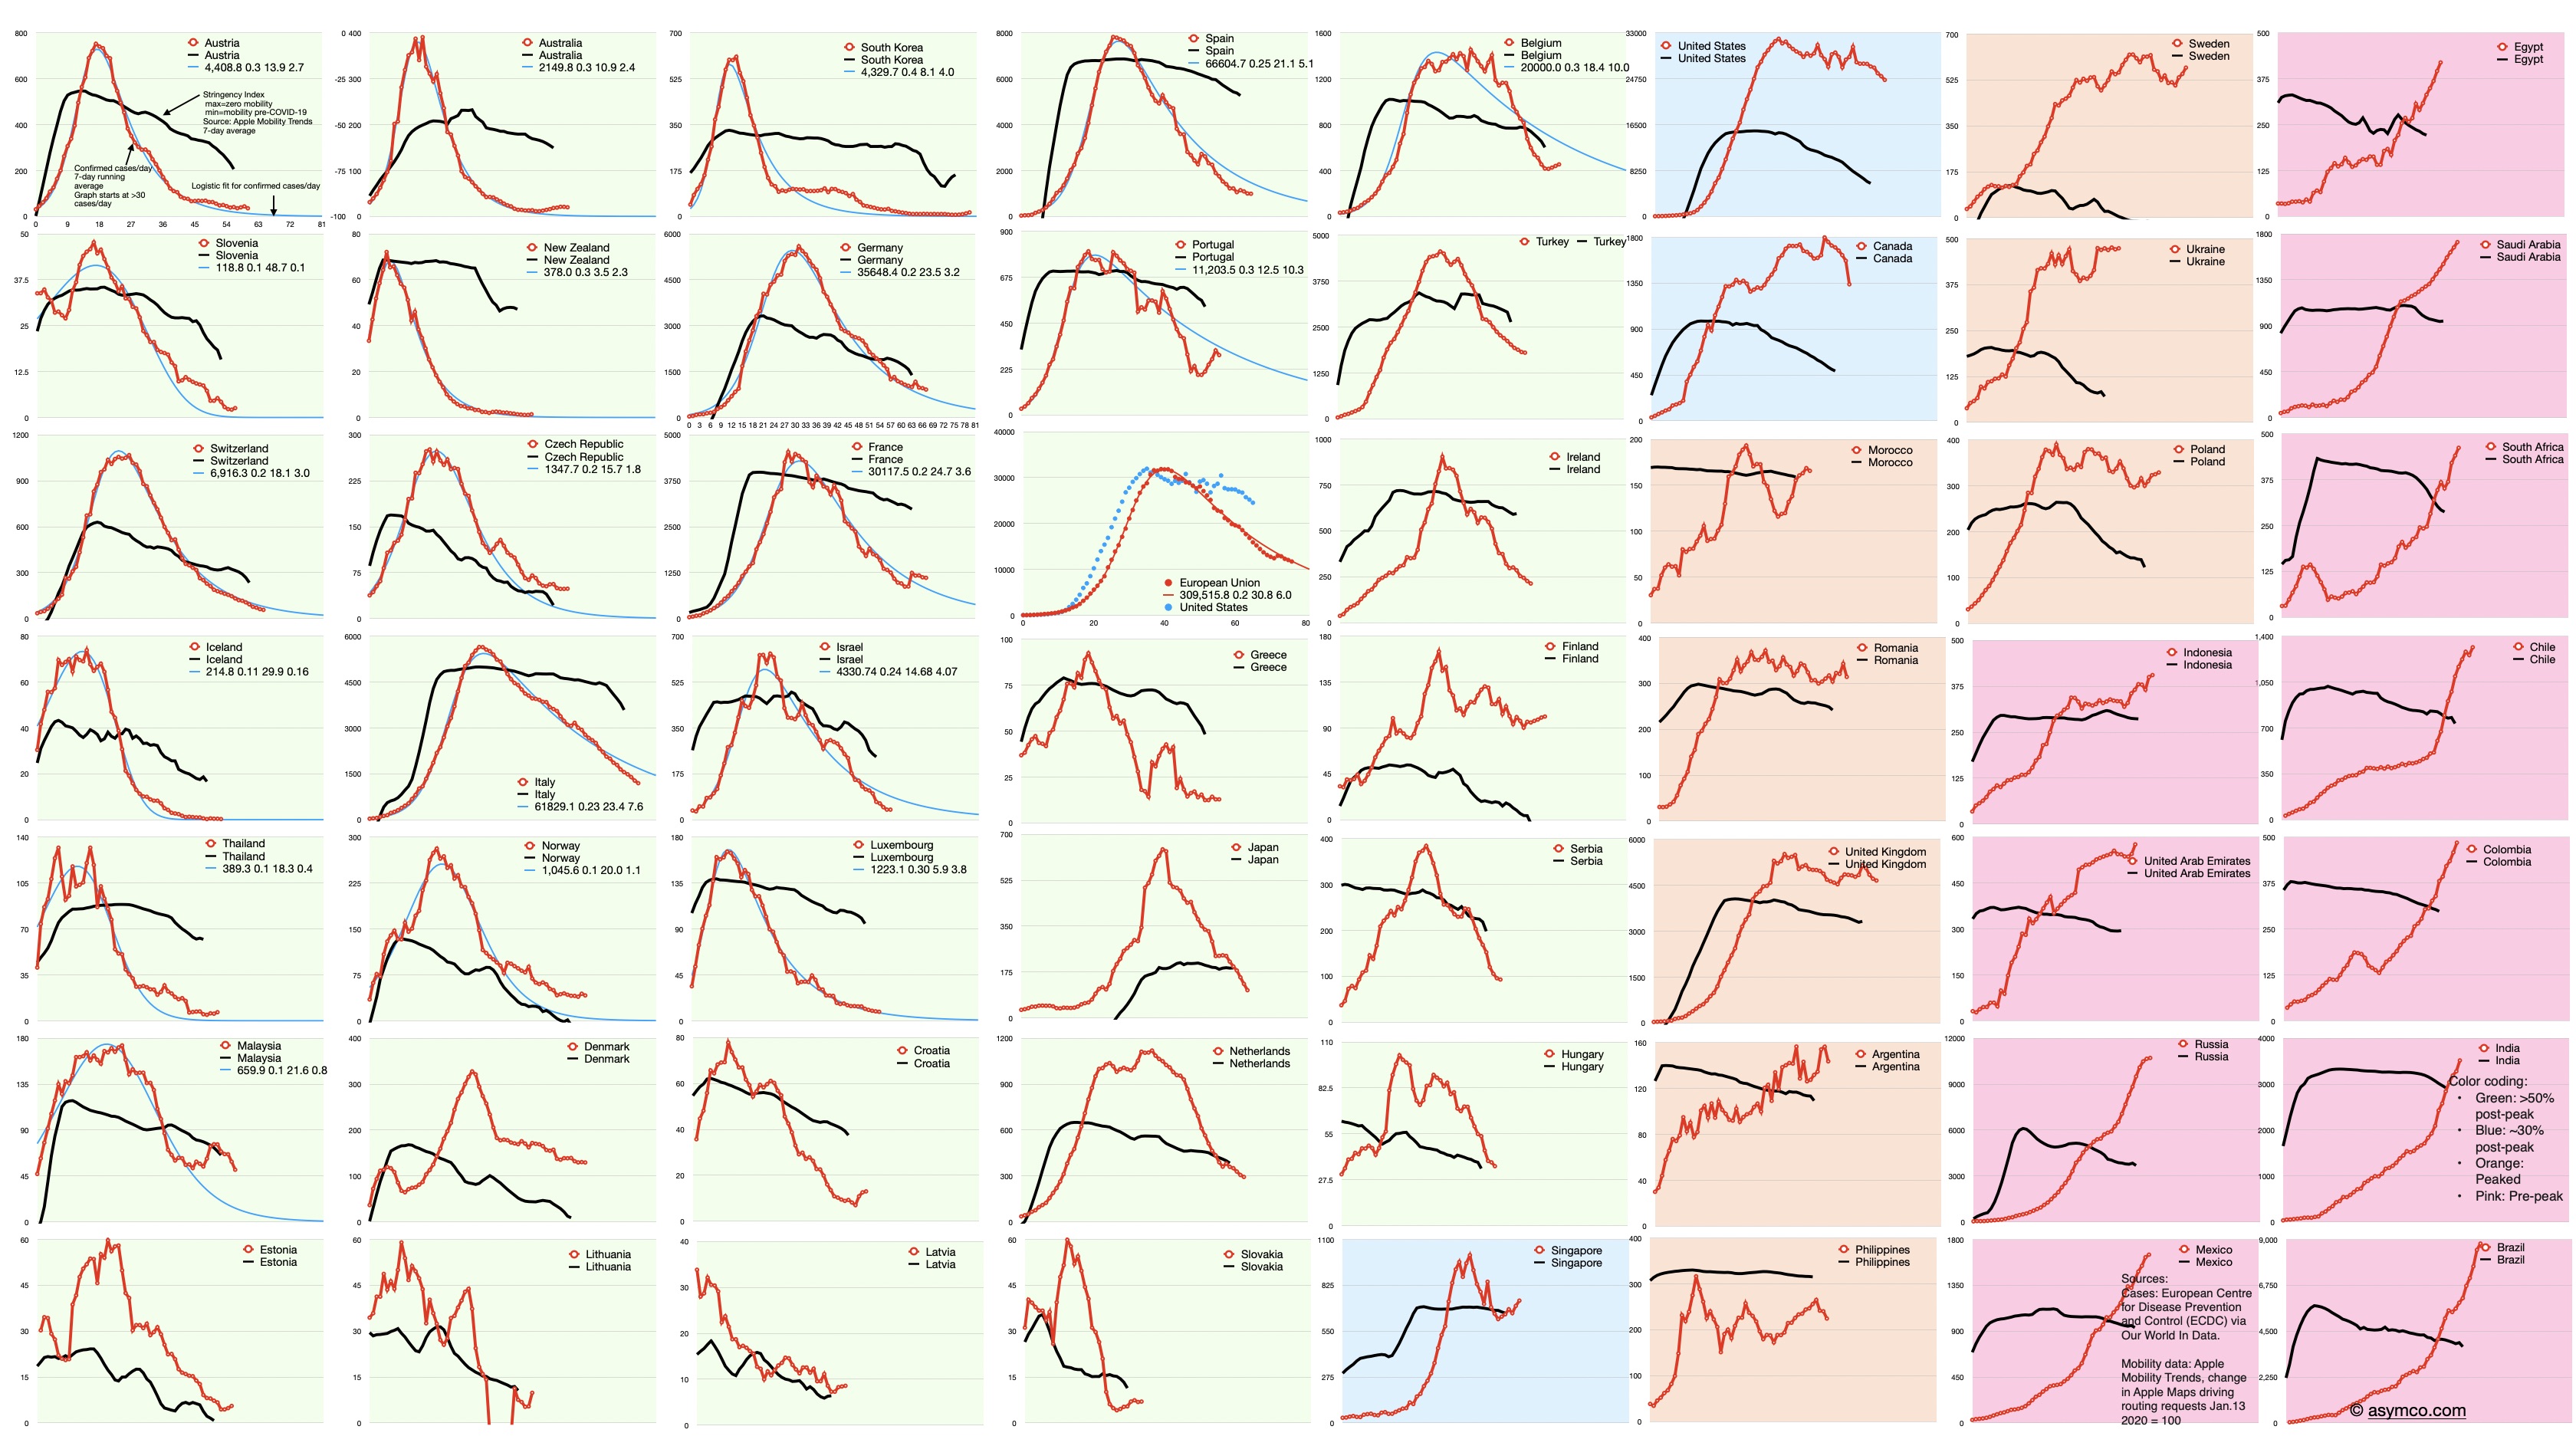
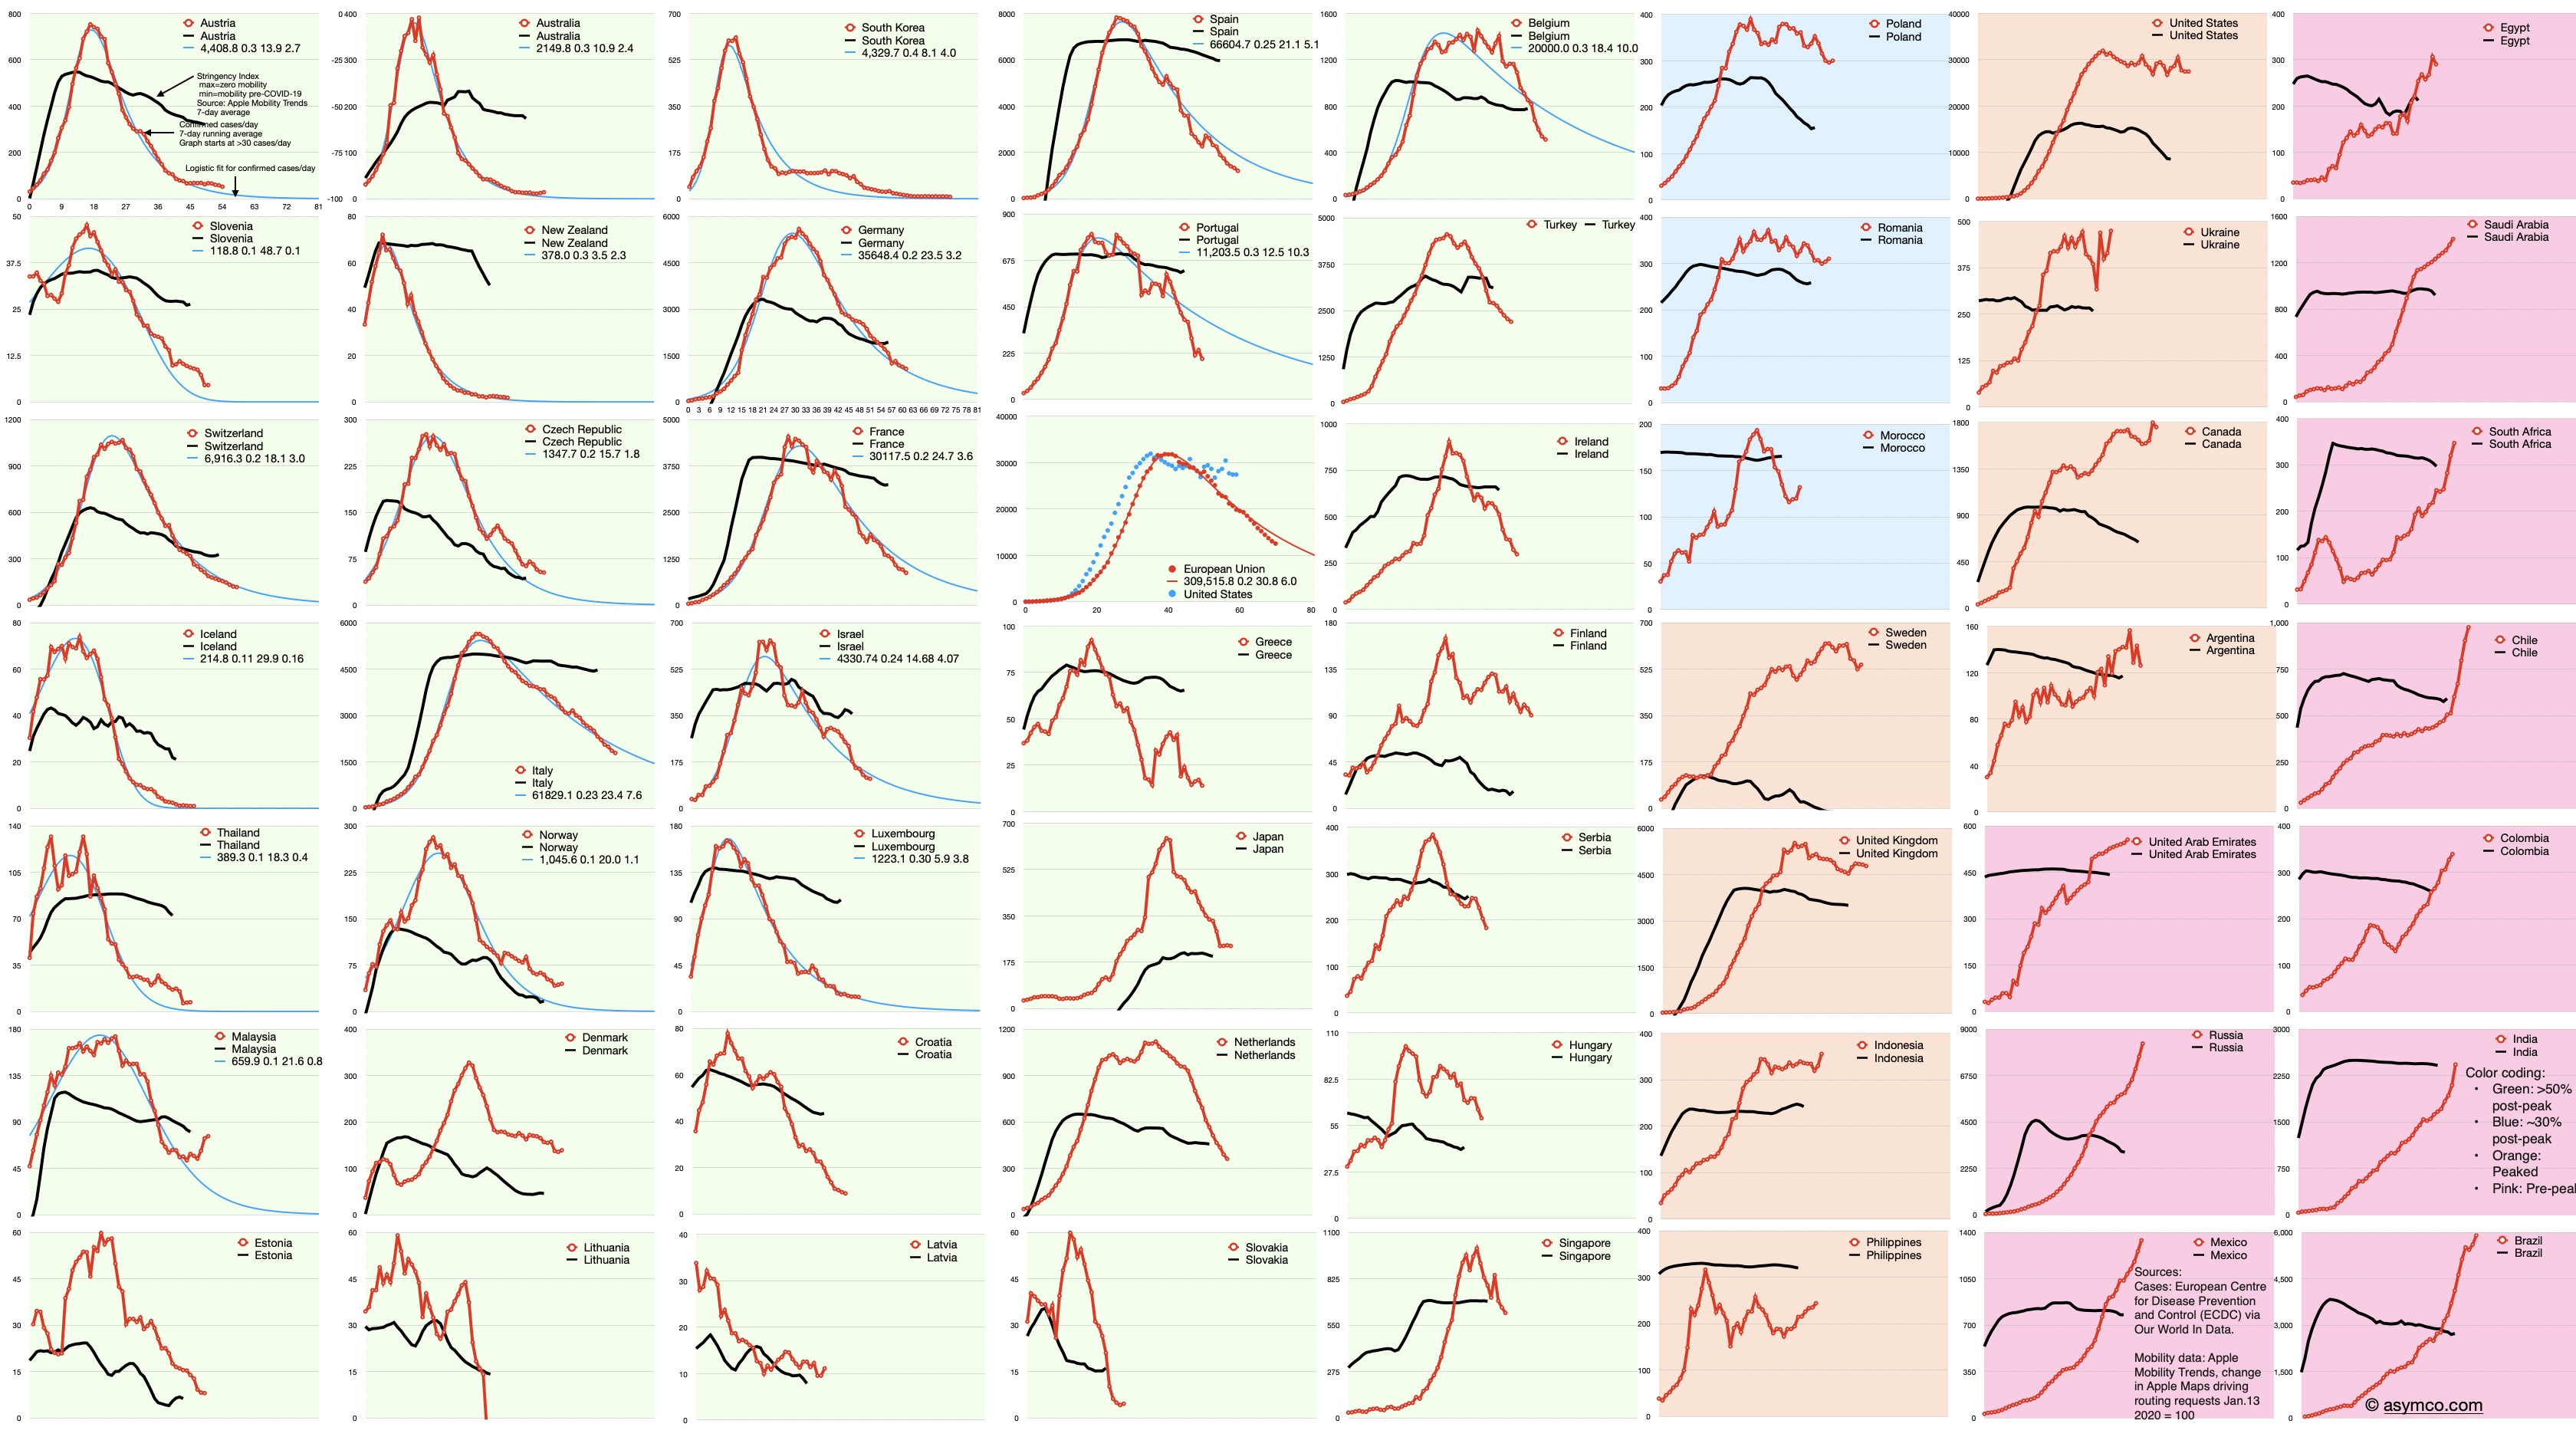
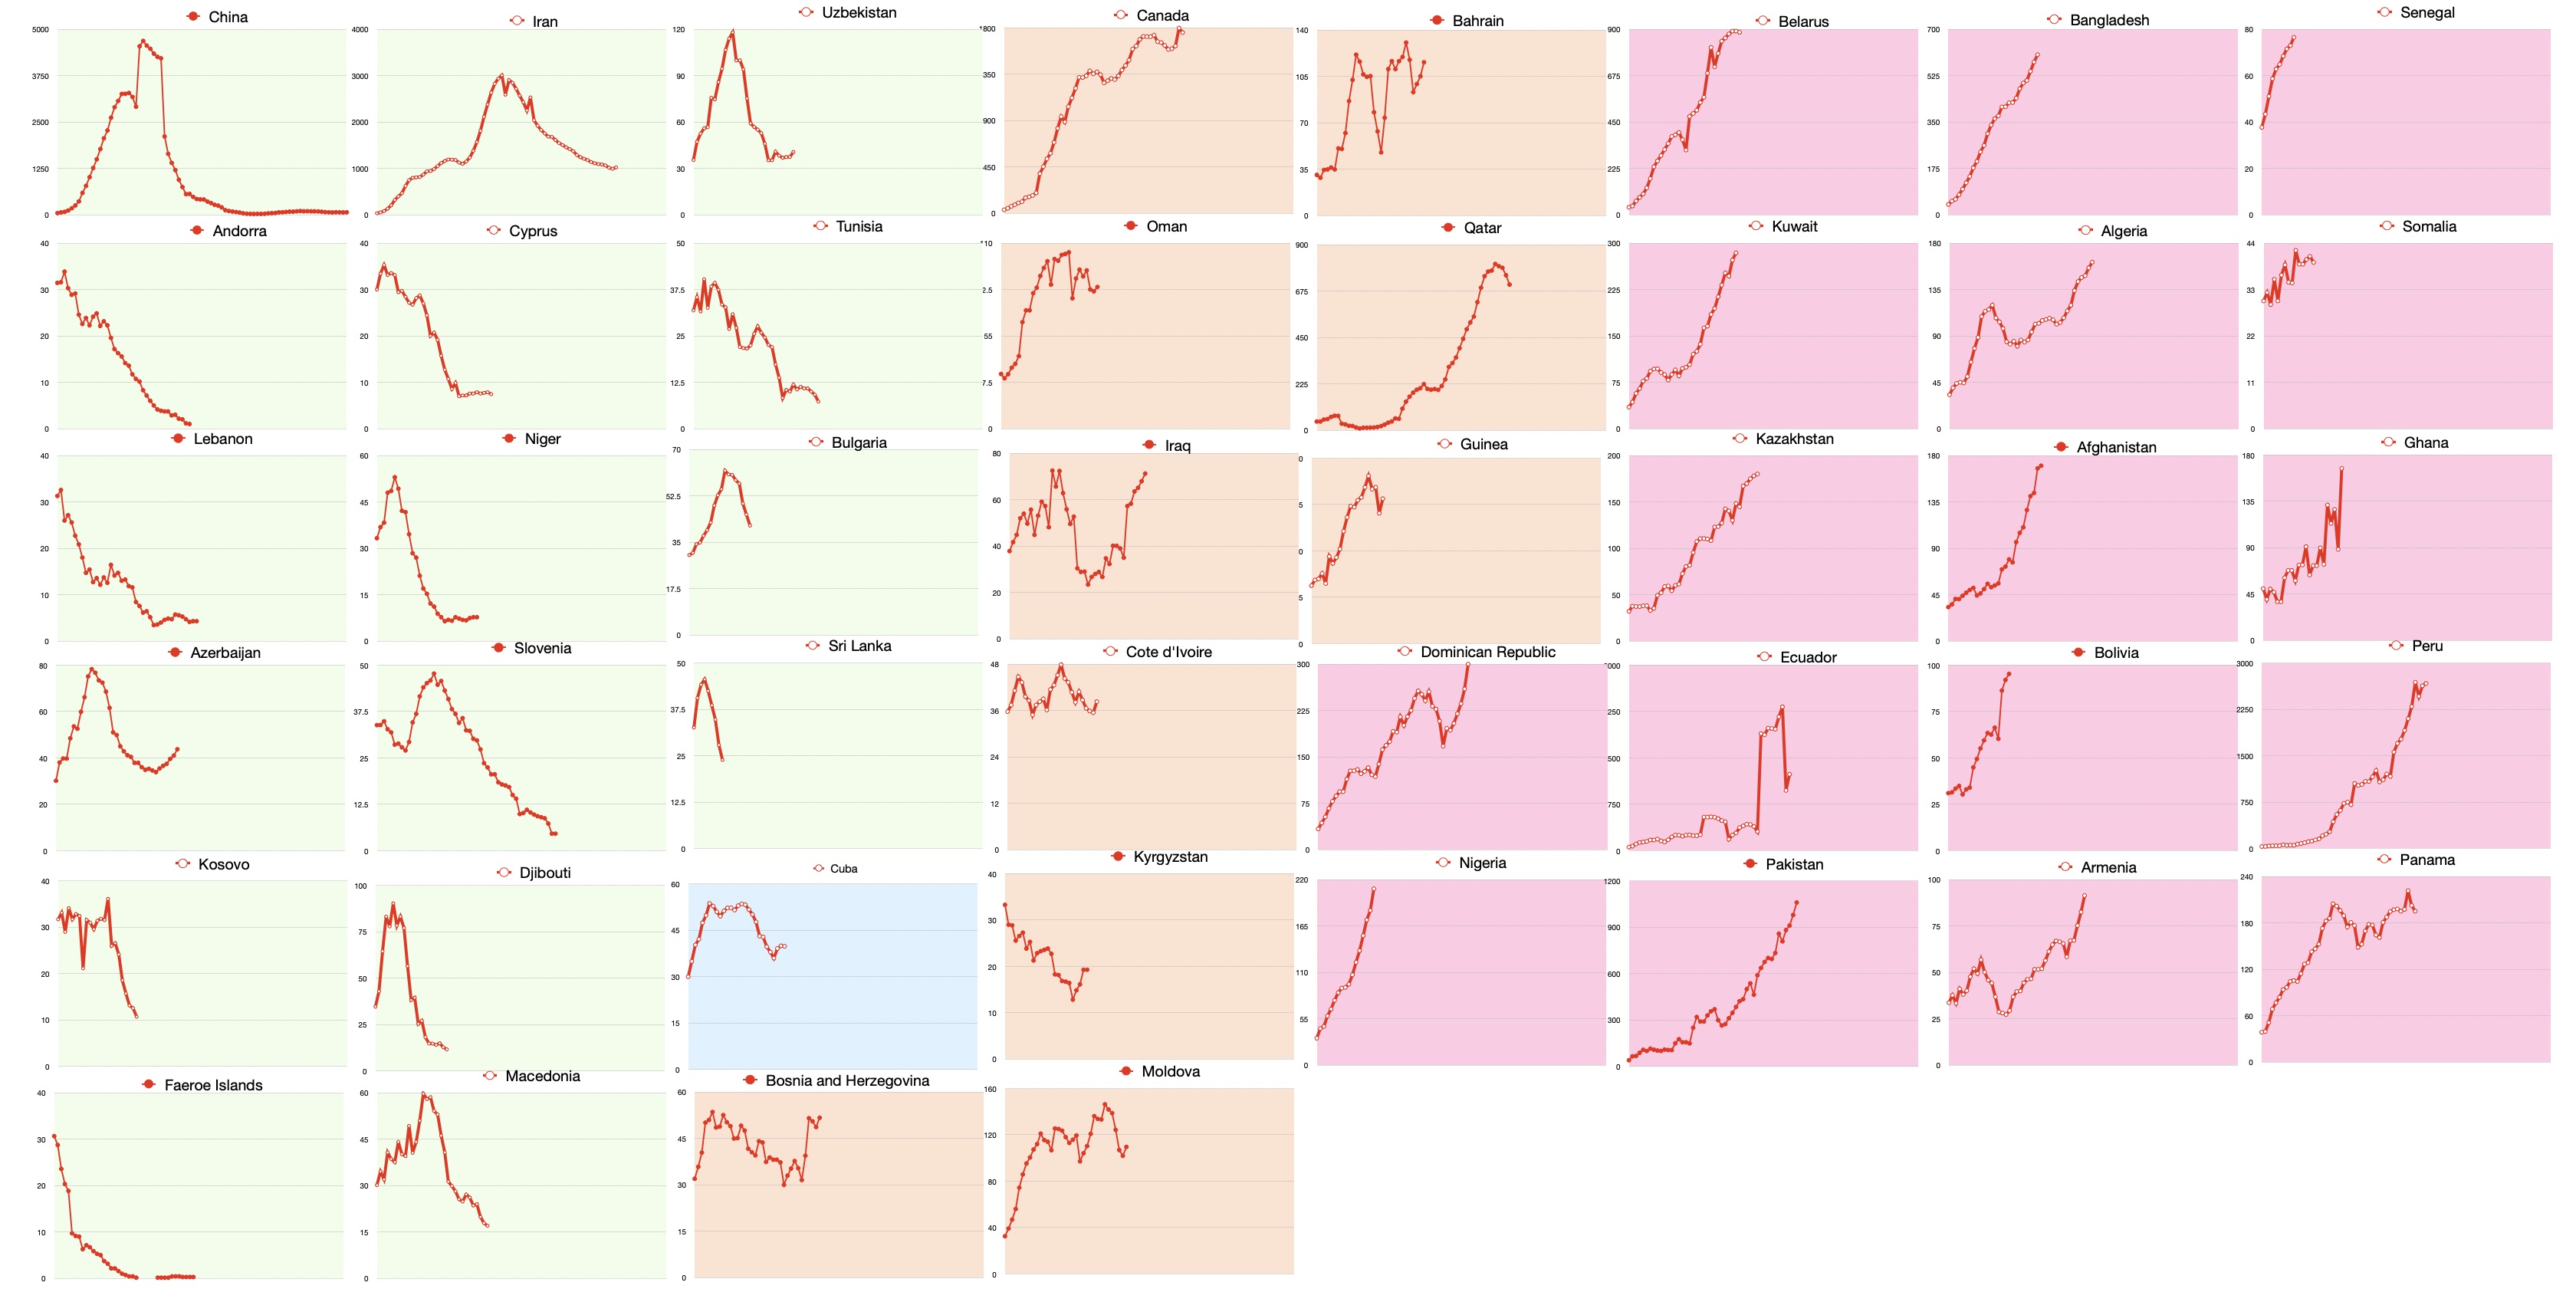
The Covid-19 case rate for 99 selected countries and the EU. Apple Mobility Trend for 57 countries.
Background color coding:
Green: Late Stage (>50% post-peak)
Blue: Middle-Late Stage (~50% post-peak)
Orange: Middle-Early Stage (peaked)
Pink: Early Stage [or indeterminate] (pre-peak)
Red line is case rate in cases/day starting at 30 cases/day. Black line is Stringency Index which is inverse of Apple Mobility Trends (lower bound means no change in mobility, upper bound is zero mobility). All points are 7-day averages. Click on images for higher resolution or download.
Sources: Cases data from European Centre for Disease Prevention and Control (ECDC) via Our World In Data. Mobility data is sourced from Apple Mobility Trends which tracks change in Apple Maps routing requests.
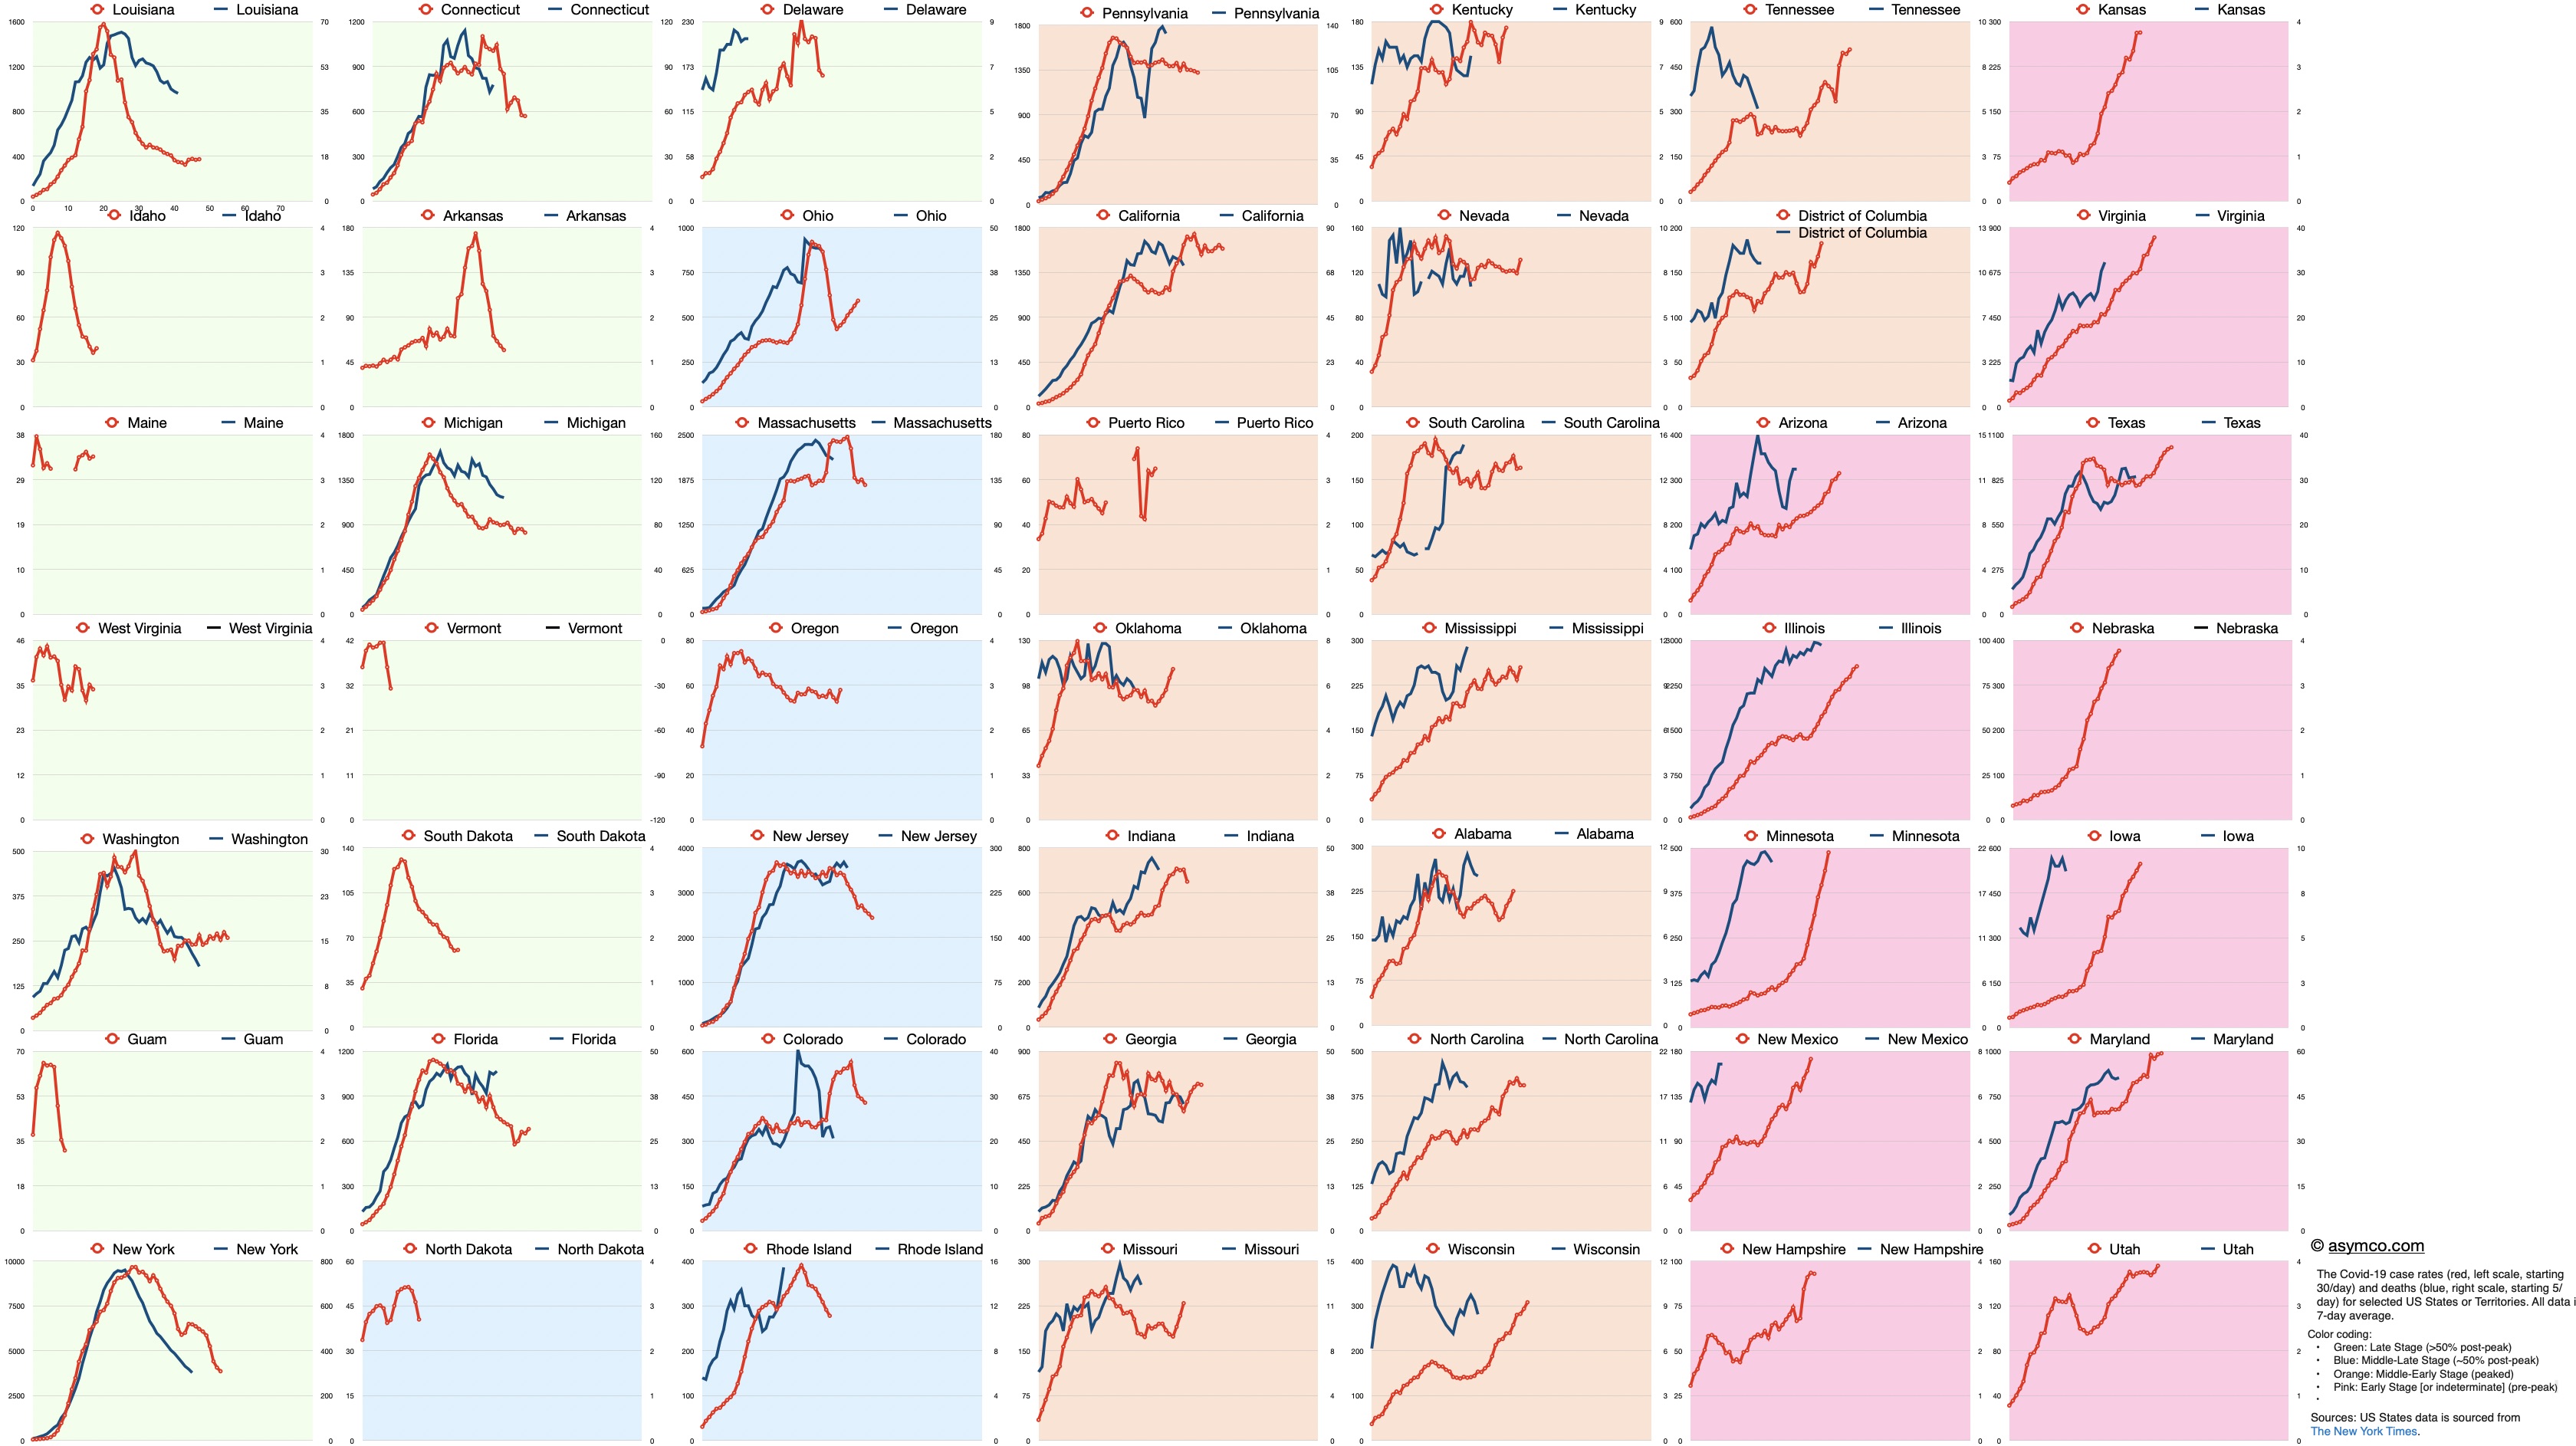
The Covid-19 case rates for 49 selected US States or Territories including deaths/day data. Note that the two curves are not for the same dates but are offset in time to start from 30 cases/day over a 7 day average and 5 deaths/day over a 7 day average
Red line is case rate in cases/day starting at 30 cases/day, left scale. Blue line is death rate in deaths/day starting at 5 deaths/day, right scale. All points are 7-day averages. Click on image for higher resolution or download.
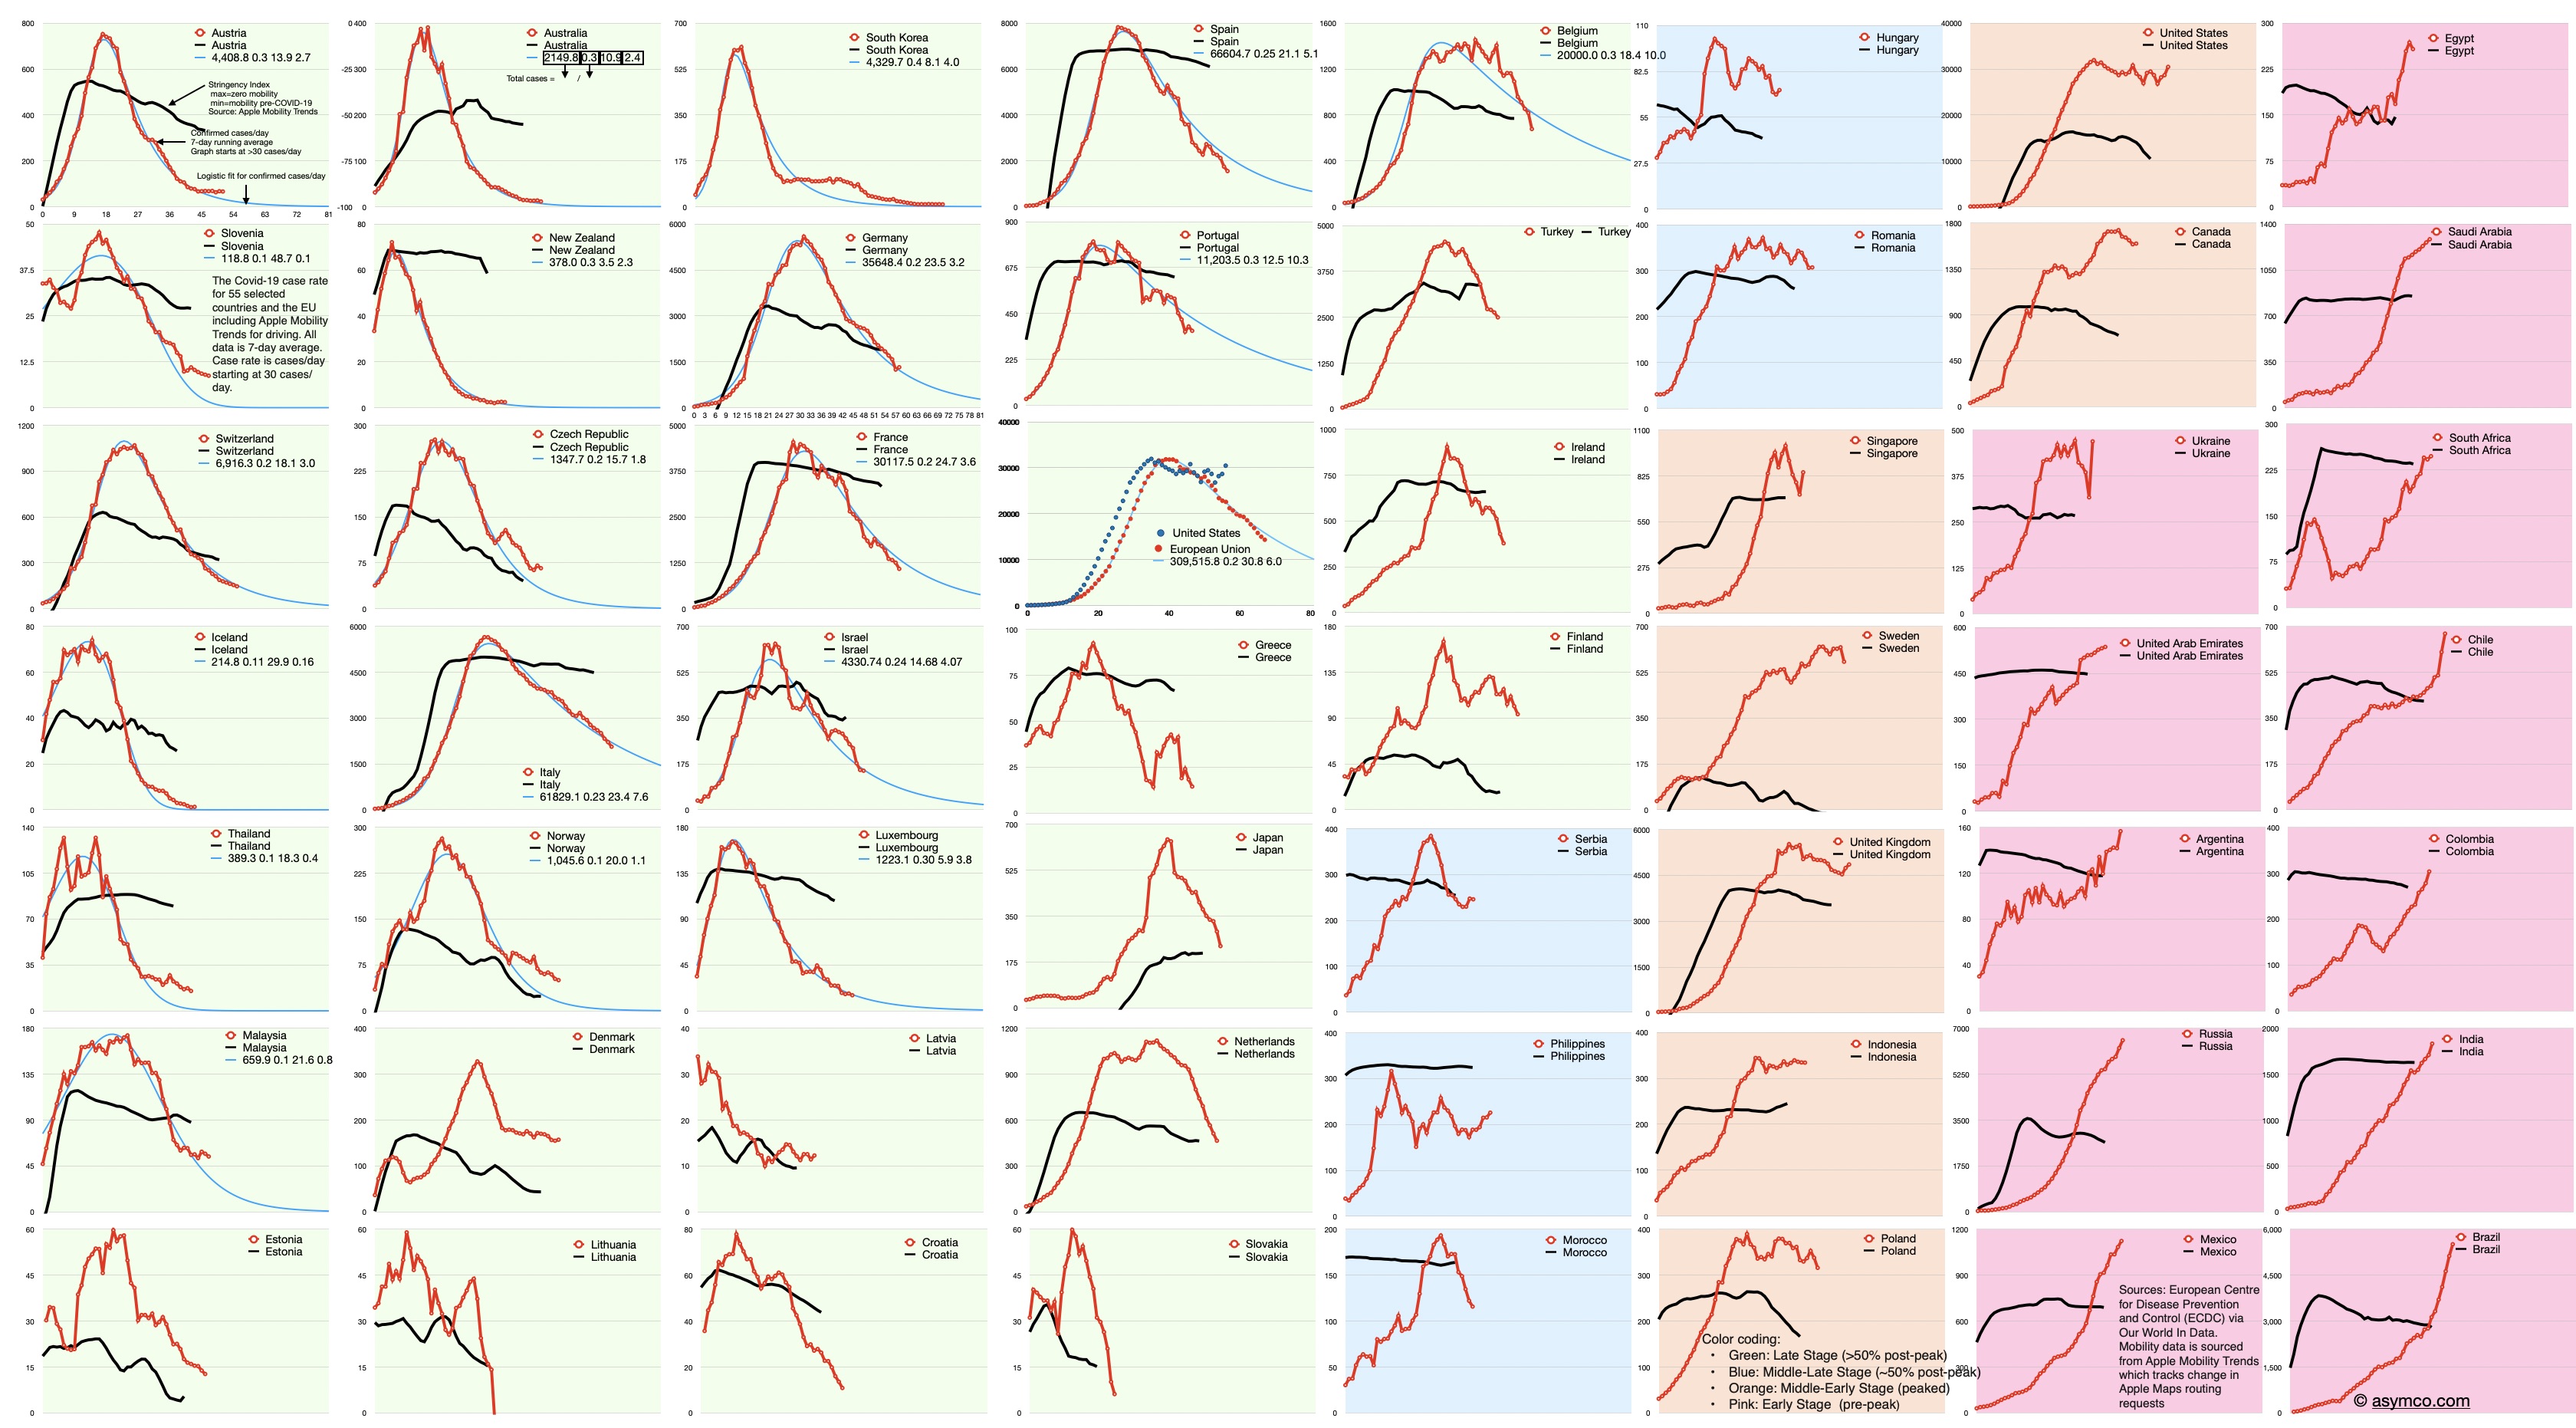
The Covid-19 case rate for 99 selected countries and the EU. Apple Mobility Trend for 55 countries.
Background color coding:
Green: Late Stage (>50% post-peak)
Blue: Middle-Late Stage (~50% post-peak)
Orange: Middle-Early Stage (peaked)
Pink: Early Stage [or indeterminate] (pre-peak)
Red line is case rate in cases/day starting at 30 cases/day. Black line is Stringency Index which is inverse of Apple Mobility Trends (lower bound means no change in mobility, upper bound is zero mobility). All points are 7-day averages. Click on images for higher resolution or download.
Sources: Cases data from European Centre for Disease Prevention and Control (ECDC) via Our World In Data. Mobility data is sourced from Apple Mobility Trends which tracks change in Apple Maps routing requests.
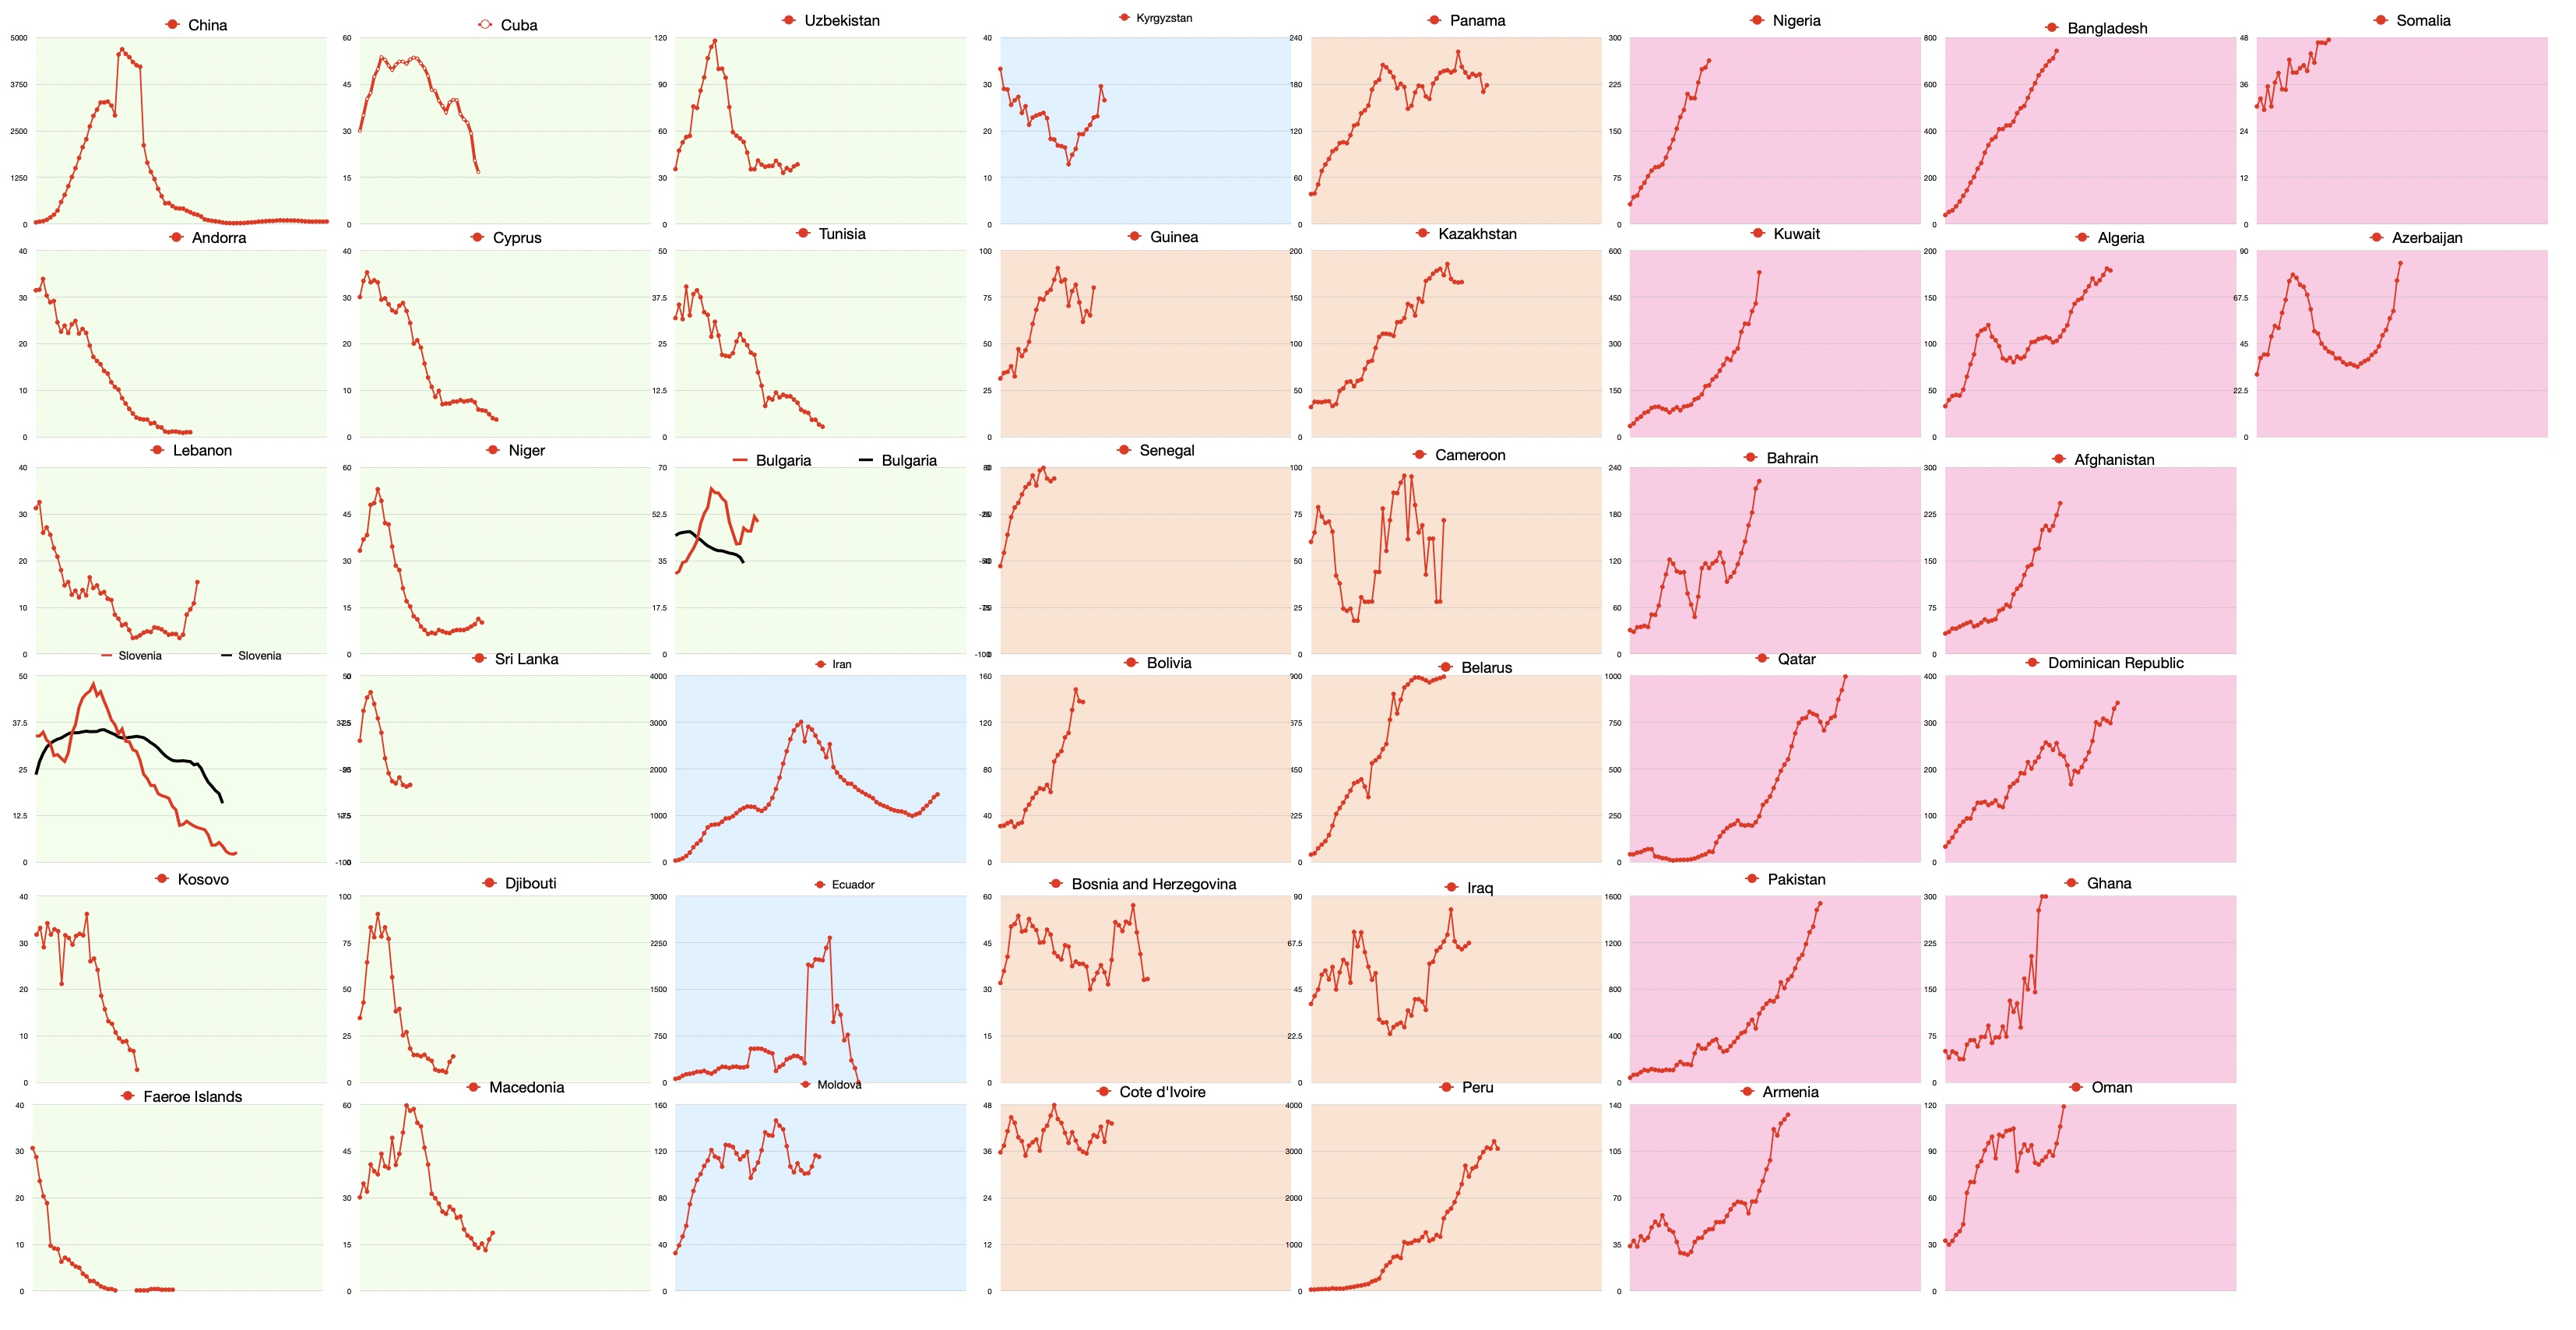
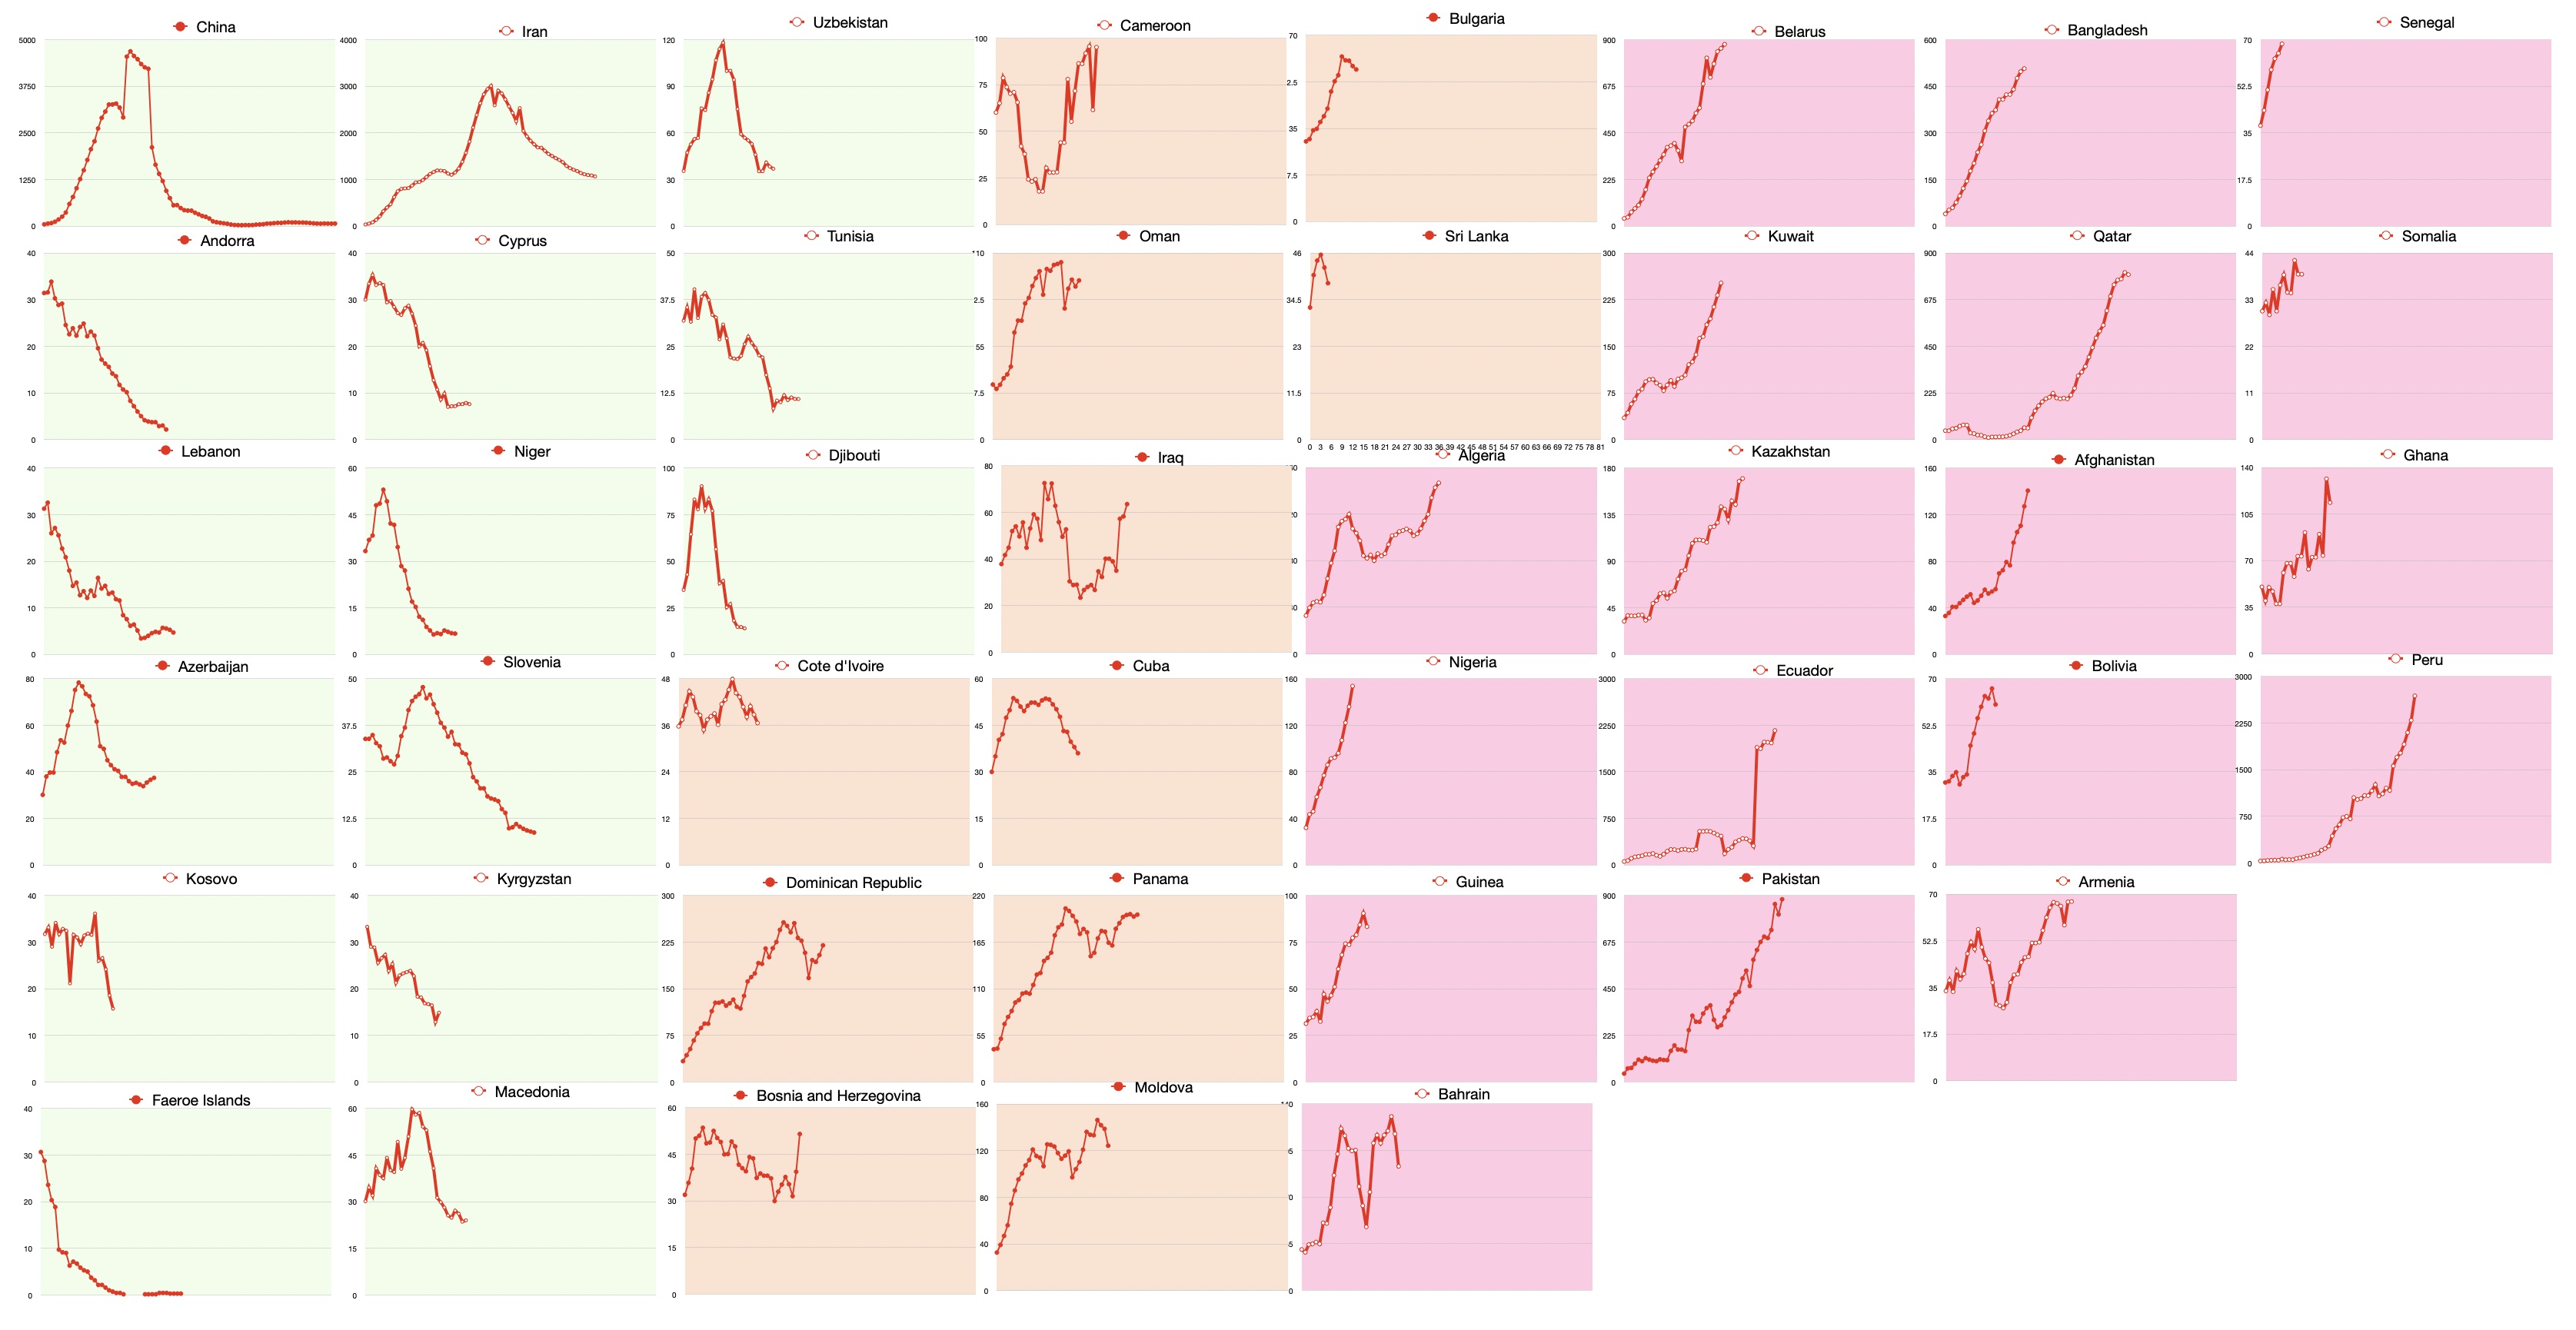