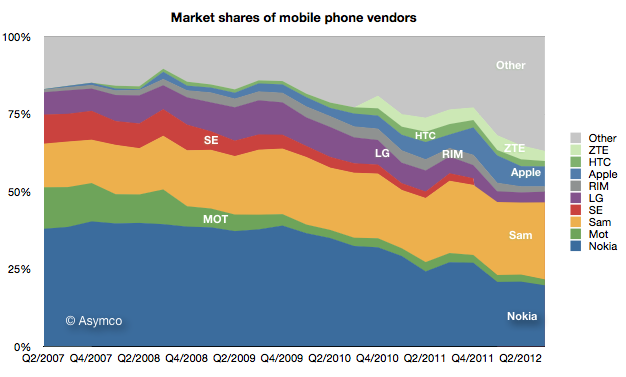
Horace and Moisés talk about the consequences of Samsung’s absorption of all Android profits, the limits of iPhone’s addressable market, Apple bear markets and, like an object in orbit, how Apple seems to always be falling but never hits Earth. Finally, Horace introduces Asymconf California.
Author: Horace Dediu
Asymconf California
Asymconf California is the second[1] in the series and will expand in scope and intensity relative to the first event in Amsterdam. Attendees will be treated to an engaging, participatory experience. Using the case method to teach (and learn), we will look at the state, history and future of innovation as seen from a Californian perspective.
There will be four themes:
- Being Back. How California came to disrupt and be disrupted.
- It’s always sunny. Californians invented the concept of lifestyle. Did they also invent the concept of business style?
- Going West. The role of frontiers (geographic, conceptual and societal) in the creation of wealth. Escaping the zero-sum trap.
- North vs. South (California.) A modern civil war.
Distinguished guests will be invited to act as presenters and panel members.
Asymconf California will take place January 30, 2013[2] at the IBM Almaden Research Center near San Jose, California.
Two workshops are also planned. Read more and register at asymconf.com.
—
- You can purchase the proceedings from Asymconf Amsterdam.
- The day before Macworld/iWorld in San Francisco. Transportation will be arranged from SF.
Google vs. Samsung
Samsung’s recent success in mobile phones has been spectacular. It overtook Nokia for the top spot in overall unit sales.  It went from having almost no smartphone sales to selling over 50 million units per quarter in a matter of two years. Continue reading “Google vs. Samsung”
On not being boring: A dramatic reading of Apple's share price
Apple’s renaissance began with the iPod. This was not evident right away however. The product was unveiled on October 23, 2001 at a time when Apple’s share price had just fallen 70% from year-earlier levels. It was perhaps a good point from which one could expect a recovery to begin.
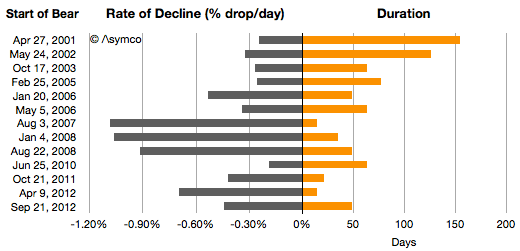
It was not to be. One year after the iPod’s launch the stock price had fallen another 20%. Indeed during 2001 the company was in the throes of a “bear market” in its shares. If we measure a time of persistent share price reduction as a bear market, then the one in 2001 was significant. For 154 days, between April 27 and September 28, 2001 the shares fell 38%. This represents the first bar in the following graph showing all the Apple bear markets since then.
I also illustrated these bear markets in terms of their duration and the average %drop/day.
Chronicling these periods: Continue reading “On not being boring: A dramatic reading of Apple's share price”
Minding the store
Apple’s Retail head was recently replaced. The hire seems to have been a mistake dealt with quite swiftly. It is tempting to think that the firing of a manager is due to a failure in their performance, measurable in quarterly reported metrics. But this is not often the case. It may be true of sales or some operations, but most strategic management decisions take months to make and years to implement before you can have the luxury of measured results. And even then the dependencies of performance are many and outside the control of specific managers.
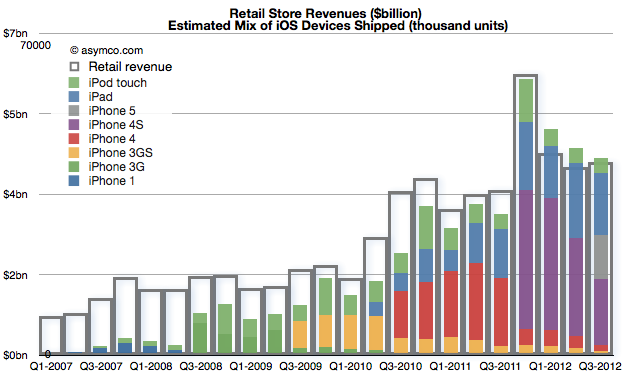
John Browett joined Apple in April and left in October. A mere six months. How did Apple retail perform in those two quarters? Very well actually. Which is to say, as well as it has previously given the overall performance of the company. The correlation can be shown between store revenues and iOS device shipments:
Store visits increased to 94 million in Q3, second only to fourth quarter of 2011. The growth was 21%. Year-on-year growth in revenues was about 17% for both quarters, in-line with company growth. Profits grew 5% in Q2 and 25% in Q3.
Average visitors per employee picked up slightly but remained largely unchanged since 2008. Continue reading “Minding the store”
ReCapEx now available for iPad, iPhone and iPod touch
In addition to the video (On Capital Spending’s Transformation of the Electronics Industry – YouTube), you can download the presentation used as an iPad Perspective story here.
It is a featured story on Perspective App on the iPad and now on iPhone and iPod touch.
5by5 | The Critical Path #62: The New Chess Game
In this episode Horace and Moisés discuss the iPad mini launch weekend (vis-a-vis older iPads and Windows 8), the curious case of choosy late adopters of smartphones in the US and the mystery of Apple’s capex late in the year. Horace spins a yarn about how Apple is playing chess with Sharp and Foxconn (and others) vs. Samsung.
ReCapEx: The curious case of Apple's 2012 and 2013 Capital Expenditures
The latest yearly report from Apple includes, as it has in the past, the forecast of Capital Expenditures. I’ve been tracking this data as an indicator of both strategic intent and potential forecasting tool for iOS device production.
Before exploring Apple’s own forecast, we should look at how they met expectations for fiscal 2012.
In October 2011 the company forecast was as follows:
The Company anticipates utilizing approximately $8.0 billion for capital expenditures during 2012, including approximately $900 million for retail store facilities and approximately $7.1 billion for product tooling and manufacturing process equipment
In October 2012 it reported:
The Company’s capital expenditures were $10.3 billion during 2012, consisting of $865 million for retail store facilities and $9.5 billion for other capital expenditures, including product tooling and manufacturing process equipment, and other corporate facilities and infrastructure. The Company’s actual cash payments for capital expenditures during 2012 were $8.3 billion.
There are two points that need to be highlighted:
- Expenditures overall were $2.3 billion higher than forecast. Nearly all of the over-spending was for “product tooling, manufacturing process equipment and infrastructure”. Retail was planned at $900 million and actual was $865 (an under-spend of $35 million). As no major real estate assets were acquired (change in those assets was $380 million, less than 2011 or 2010) the “deficit” in budgeted expenditures can be attributed entirely to product tooling and manufacturing process equipment.[1] The $2.3 billion spending over expectations amounts to 34% of forecast.
- The cash payments for capex were $2 billion lower than expenditures. This is a curious situation which was not highlighted in previous 10 K reports. What this implies is that much of the “over-spend” was not paid for though cash and since no new debt was booked it’s likely to have been paid for through some form of vendor financing. I’ll explore some explanations below.
So it’s important to note that the company spent a great deal more (one third more) than expected and paid for some of the acquisitions through uncharacteristic or unorthodox means.
The historic budgeting for Machinery & Equipment (+Land & Buildings) is shown in the following graph: Continue reading “ReCapEx: The curious case of Apple's 2012 and 2013 Capital Expenditures”
On Capital Spending's Transformation of the Electronics Industry – YouTube
Asymco’s Horace Dediu on Capital Spending’s Transformation of the Electronics Industry – YouTube.
A video of Horace Dediu’s presentation at IBM’s Electronics Global Leadership Forum in Taipei on 23 October 2012. Horace discusses how Apple’s enormous capital spending is reshaping the global supply chain for the industry.
The policymaker's dilemma
Here is an exchange with Robert van Apeldoorn, Journalist with Trends Tendances Magazine in Belgium. (www.trends.be/fr). The exchange took place in early September via e-mail.
Robert: -Information and Communications Technology (ICT) is considered in Europe as a way to push growth, and is a target of national and EU policies (digital growth,etc), but the result seems to be a failure: the European computer industry (hardware) is almost dead (ICL, Siemens computers bought by Fujitsu, Olivetti almost out of computer business, Nixdorf dead) since the 90’, and the telco industry seems to be in crisis. All European companies are out of the handset business (big and fading exception is Nokia, but with American software), and Alcatel is suffering with telco equipement manufacturing. It seems that at best, Europe can be a good niche player, with companies like ARM (chips). Technology seems to be reduced to localized services (computer services), some software businesses. What do you thing about that point of view? Is it correct or exaggerated ?
What will remain to the European companies ?The main problem is perphaps the creation of European platform/ecosystems. Almost all are American today: Apple IOS-iTunes, Android, Amazon,…
Why Symbian didn’t succeed as a competitive platform ?
Is it possible to create European platforms? After all, IOS succeed after a short period of time.
What are the European tech companies that could play an important role in the near future ? Continue reading “The policymaker's dilemma”


