Visualizing the Steve Jobs era

On October 4th, Tim Cook will take the stage at Apple’s fall event. With Steve Jobs’ transition to head the Board of Directors of Apple and after serving as CEO for fourteen years, it is time to take a look at his reign.

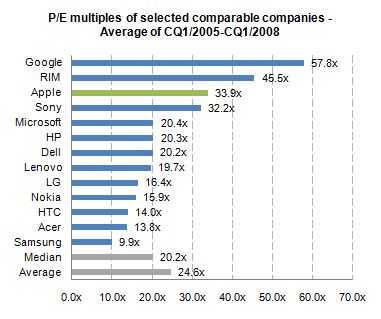
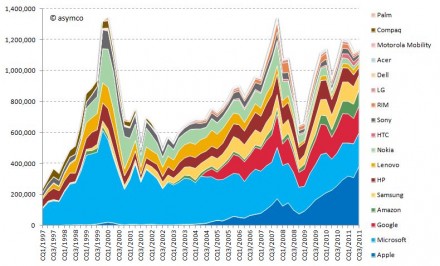
Looking at his performance vs. peer companies from a capital market performance, I have composed the following two charts:

Market capitalization of selected peer companies by calendar quarter in USD million sorted by most recent market capitalization (1997-2011)

Market capitalization of selected peer companies in USD million sorted by recent market capitalization (1997-2010)

Market capitalization as share of combined market capitalization by calendar quarter sorted by most recent market capitalization (1997-2011) Continue reading “Visualizing the Steve Jobs era”

Why Apple's shares rose after Steve Jobs resigned

CEO resignations often cause share prices to rise. Witness the effect of the latest CEO departure on Yahoo!. This typically happens because CEO replacements are not necessary when companies are successful. In times of crisis, the market sees management change as a hopeful sign. But Apple is doing well. So it was commonly believed that if Steve Jobs were to leave the helm at Apple the stock would fall. However, as the chart below shows, the stock price has since risen.

Apple’s share price rise of 3% even out-performed the Dow Jones index, and this phenomenon is not for the short term only. The Jobs resignation sent Apple puts to one-year lows.

So how do we reconcile this? How can such a valuable person be priced as a liability? Continue reading “Why Apple's shares rose after Steve Jobs resigned”

Apple and comparables P/E ratios: Is punishment for growth being dispensed equally?

Apple’s valuation has been discussed several times on Asymco. Apple’s relative valuation in terms of P/E ratio has not improved since the recession despite an acceleration in financial performance. As Apple seems to be getting punished for growth, we have to also ask if it is the only one.

When looking at valuation from an institutional investor or financial analyst point of view, the most common methodologies are discounted cash flow (DCF) as well as comparable company multiples. Most often, a DCF valuation is performed and cross-checked with comparable multiples. The justification for using comparable companies is the exposure to the same market dynamics including, for instance, market growth and profitability. So to understand this perspective, let us focus on a peer group valuation by looking at the average P/E multiples[1] for the calendar quarters 1/2005 to 1/2008[2].


Continue reading “Apple and comparables P/E ratios: Is punishment for growth being dispensed equally?”