I’m super excited to announce the Apple Investor Event 2023. This will be the third Apple Investor Event I’ve hosted but it’s been a long time since the last one.
The event will take place November 9th, 2023 in Downtown Boston Area (precise location will be announced soon.)
The program is a series of talks with data/visualizations on the following topics:
Products: Financial performance and market overview.
Services: Understanding synergies with products
Valuation: Measuring customer creation and retention
Growth: Opportunities in Products, Services and Geographies. Emphasis on new products in Spatial Computing.
Limits to growth: Market Saturation, Apple Silicon headroom, GDP growth.
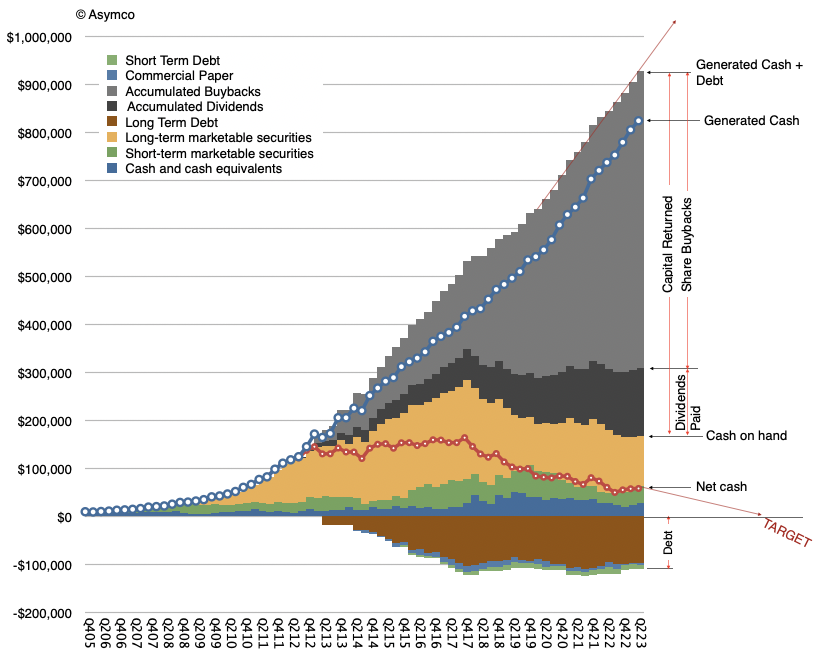
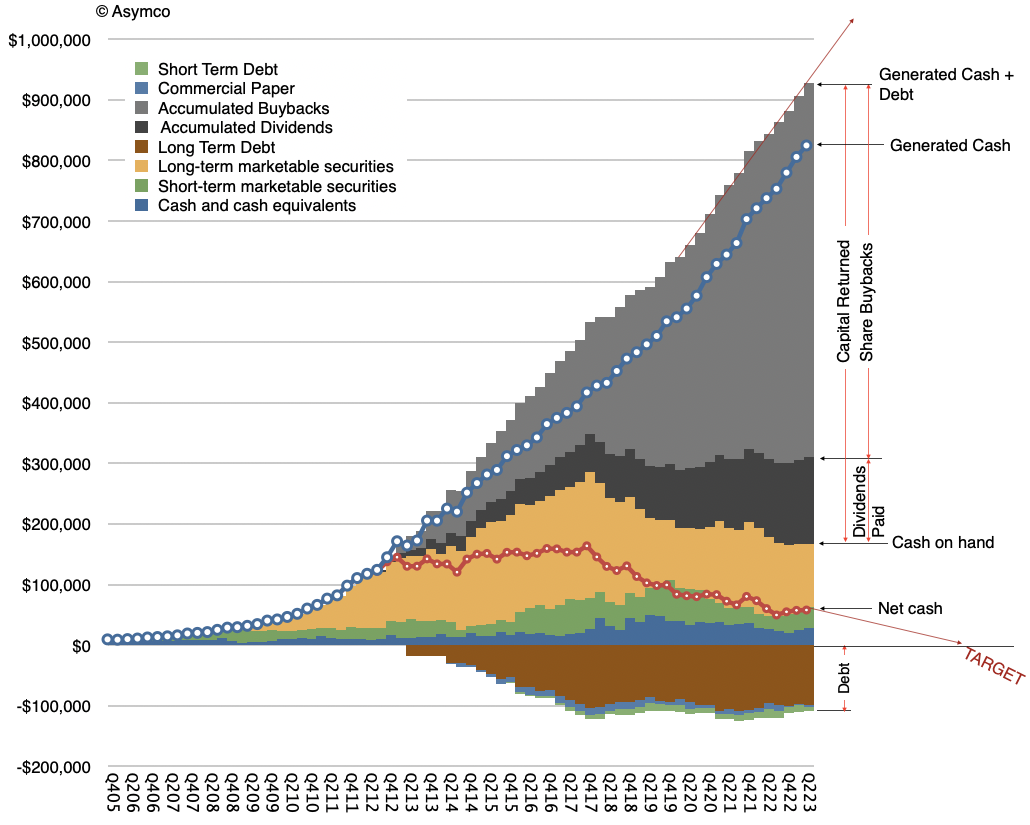
Apple has so far returned $761.5 billion to shareholders. 143.3 billion in accumulated dividends and $618.2 billion in share buybacks. These are the gray areas in the graph above. The question that often comes up is: isn’t this capital return program a misallocation? In particular isn’t buying back shares and retiring them a waste of money?
By definition, it cannot be. The mechanism of buying shares and retiring them is a process of returning retained capital to shareholders. The other ways this can be done are through dividends (periodic or one-time) or the sale of the company (liquidation). Ignoring the liquidation option which does not make sense for viable companies, the decision between dividends and buybacks comes down to a tax efficiency question.
The result is, however, roughly the same: retained earnings, which are stored by the company as cash typically (net value for Apple today is $57.2 billion), are an asset balanced by a liability to the shareholder called Total Shareholder Equity (valued today as $60.3 billion.) As such, the retained earnings belong to the shareholders. It’s why they own the company. It’s what their cash share of the value in the company is.
It’s also surplus to the company’s needs. Had the company needed this cash, it would have spent it on building the products and services it sells or operations that maintain or grow the business. Those expenses appear in cost of sales (COS) or cost of goods sold (COGS) or in operating expenses Sales, General and Administrative (SG&A) or Research and Development (R&D). If it’s not spent this way then it drops to the net income line and, crucially, is subject to taxation (about 12% to 15% for Apple). After taxation, once returned, it’s taxed again as either capital gains (in the case of buybacks) or dividend income. These rates vary on the jurisdiction of the owner and the current tax policy.
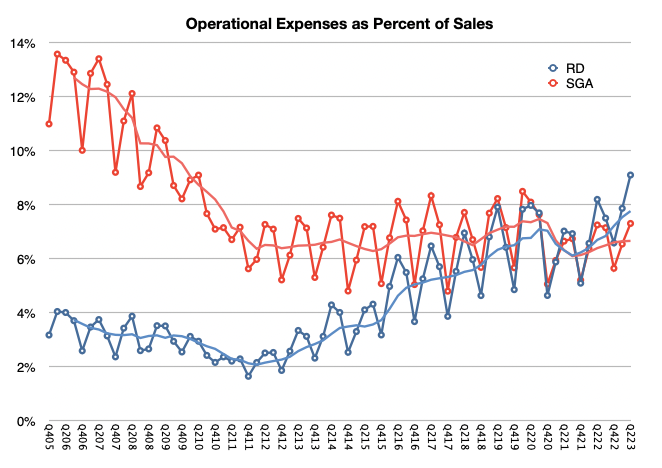
Note that the spending on R&D includes development of future projects which are not directly related to current products. Engineering of current products is expensed against COGS. R&D for Apple ($29.4 billion in last 12 months) is significant, having grown to 9% of sales, as the graph below shows.
For the company to decide to return capital it really does mean that it has no good ideas on how to spend it given what the company knows it can and cannot do. It’s a judicious decision and one which honors the relationship between owner and manager with fiduciary responsibility to the owner.
Still, doesn’t that mean it’s wasted?
No. Giving it to the shareholder means that the company says “It belongs to you, I don’t know what to do with it on your behalf, so here, you figure out what to do with it.” The shareholder can then make an allocation decision that suits their sense of what is valuable or useful. The return is a deferral of decision to the owner rather than their agent.
To the extent that once returned, the capital is misspent, that is on the spender, not on Apple.
Consider the alternatives. Instead of returning capital, what some managers decide to do is to re-allocate those retained earnings to acquire other companies with the promise of value creation through synergies. However these are often huge wastes of money. The new asset is recorded as “goodwill” on the balance sheet, offsetting the retained shareholder equity. As the synergies fail to materialize, the asset (goodwill) is written off, and shareholder equity decreases accordingly, and so, value evaporates or is transferred to the owners of the acquired company who cash out above market value.
Acquisitions are a process of picking the pocket of shareholders.
The alternative might be to spend heavily on R&D. That is more admirable but the amount involved is enormous and it’s very difficult to find enough people and projects worth pursuing without turning R&D into an academic organization. Remember that with R&D at $7.4 billion per quarter, the company is spending 41 times more than it did in 2006.
And doubling or tripling R&D, even if possible, would impact margins to such an extent that Apple’s profitability would show very poorly indeed. That would collapse share prices and decrease share-based compensation, limiting the possibility of recruiting talented engineers. It would bring quite a lot of negative consequences.
Another exercise to undertake would be to ask what would happen if the mechanism of share buybacks were made illegal. It was not always legal anyway. That is left as an exercise to the reader.
Before the iPhone launched in late 2007, Apple was trading consistently at a P/E ratio above 30. Here is a table for the P/E ratio on each Friday’s closing price from May to August, 2007. The iPhone launched on June 29, 2007.
Date
P/E Ratio
5/23/07
31.5
5/30/07
31.6
6/6/07
34.1
6/13/07
33.7
6/20/07
34.6
6/27/07
33.6 (2 days before iPhone launch)
7/11/07
37.2
7/18/07
34.6
7/25/07
34.3
8/1/07
33.3
8/8/07
34.2
8/15/07
30.2
Apple’s P/E ratio around the iPhone launch
Apple was not super powerful but it was not doomed either. It was a time when the iPod was dominant and the Mac was still alive. iTunes re-wrote the rules of the music industry and debate was raging whether Apple should be considered a media company. Platforms were not its strength but Steve Jobs showed he was still able to distort reality.
These good times did not last. The first year of the iPhone was a period of minimal contribution from the new category with Apple still largely valued on the basis of the iPod. The predictions of failure for the new communications product, especially given its high price, were legendary. It wasn’t until 2008 that the iPhone began accelerating and making a meaningful contribution to the bottom line.
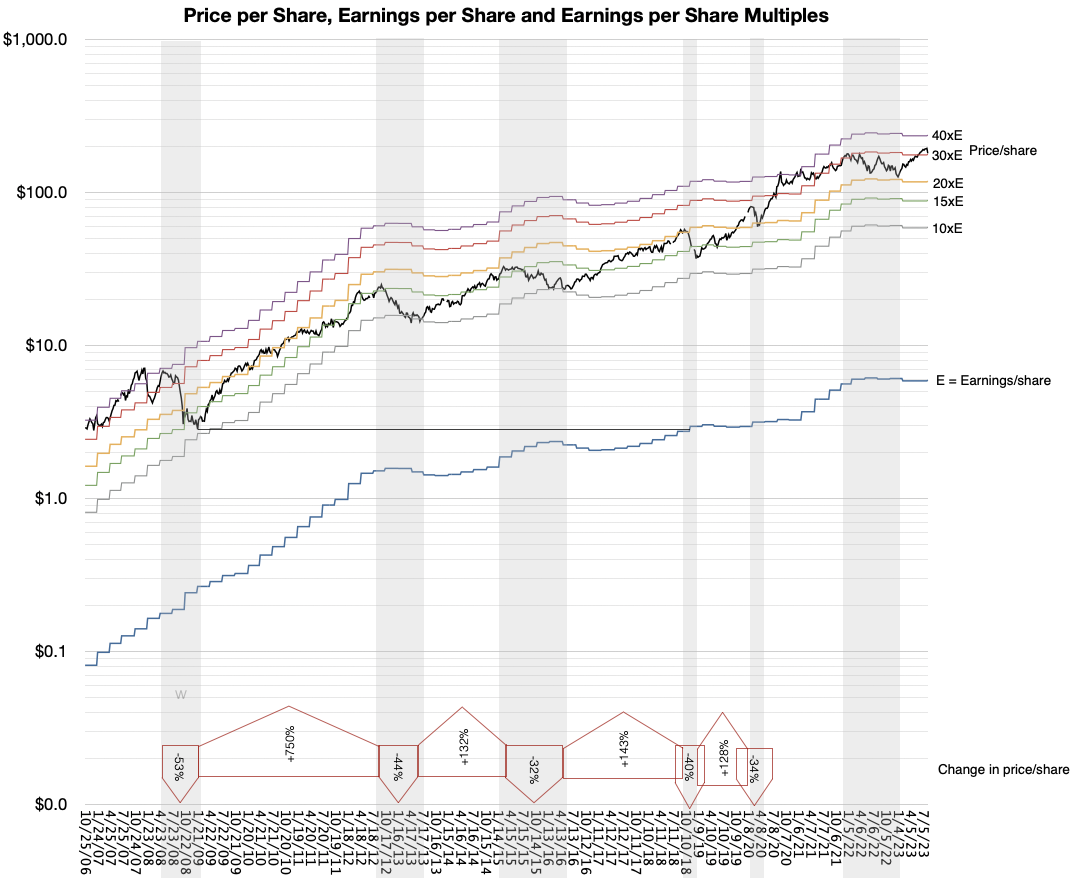
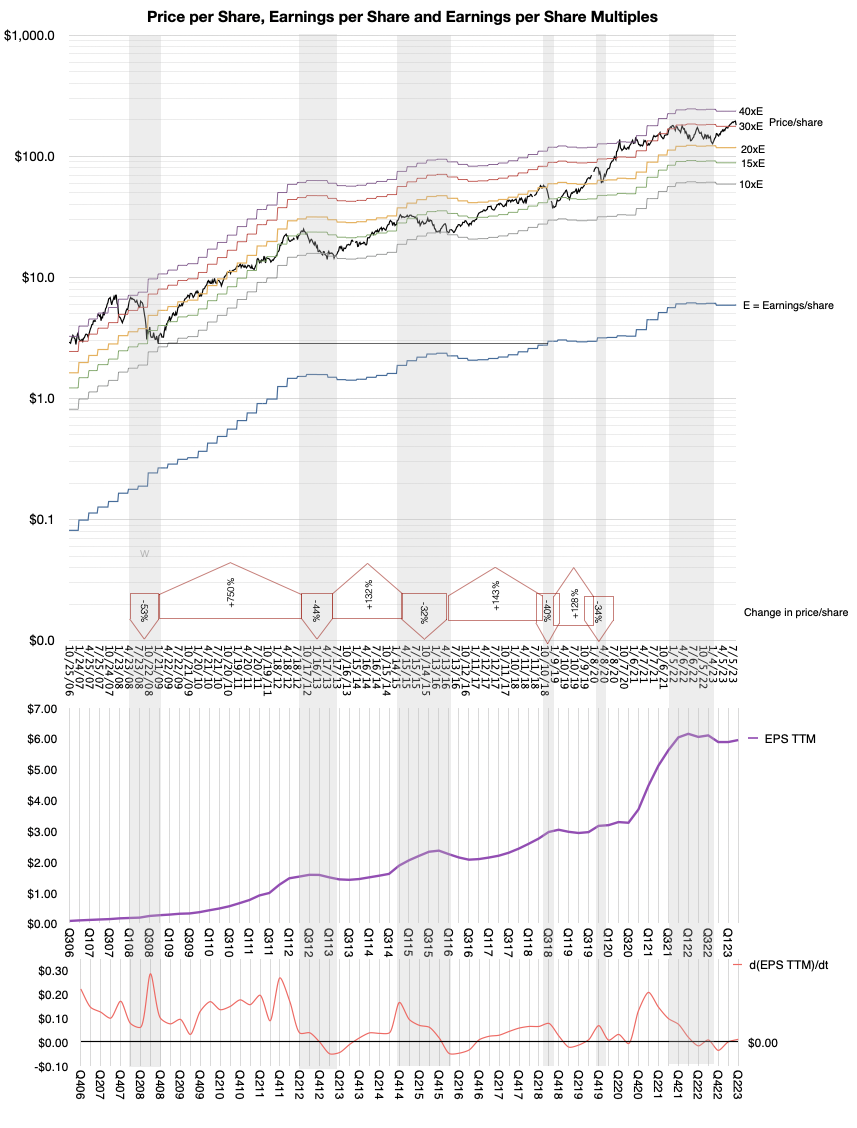
It was then, in late 2008, that Apple’s valuation broke. The P/E ratio fell from above 30 to nearly 10. The following graph shows the catastrophic 53% share price collapse coupled to the triple digit surge in earnings which led to the P/E ratio tanking.
[The graph shows earnings per share for the trailing 12 months (blue line) and 10x, 15x, 20x, 30x and 40x that value (colored lines). The share price is the black line. The share prices are sampled every Friday. The graph is notably logarithmic. The grey shaded areas are periods of significant contraction. The percent drops/increases during these periods of contraction/expansion are shown in the annotation arrows near the bottom.]
The valuation remained broken for 12 years, between late 2008 and late 2020. This period being, arguably, the most remarkable wealth creation event in history of business. For evidence see the following graph showing the amount of retained earnings returned to shareholders building inexorably toward one trillion dollars. This is not share price appreciation but cash returns. [If you have evidence of a larger wealth-creation event do let me know.]
The creation of $800 billion of shareholder wealth at fire-sale share pricing.
As I explained throughout this period, motivation to dispose of shares which create immense wealth is explained by the fable The Goose That Laid the Golden Eggs but the question some are asking now is whether more wealth can still be created, and if so, can we expect Apple’s valuation to collapse accordingly?
I should note that during the long, dark years of wealth creation, other technology companies such as FaceBook, Amazon and Netflix, Google (so-called FAANG) and Microsoft enjoyed far higher multiples than Apple, sometimes 3x higher. This was not seen as abnormal by analysts because those companies were always assumed to have higher growth potential, with a diverse portfolio of opportunities while Apple’s growth was perpetually in its past, based on one product.
Paradoxically perhaps, since the Covid-19 pandemic Apple shares have enjoyed P/E ratio roughly equivalent to the other tech companies. For instance, peaking at 42 in January 2021, the P/E ratio has averaged about 27.5 since then. Simultaneously, diversified companies such as FaceBook (now Meta) and Netflix collapsed due to serious business model flaws (based on single sources of income) and Google (now Alphabet) and Amazon have slowed growth and are facing anti-trust scrutiny. Having lost any presence in mobile computing Microsoft has become entrenched in enterprise, finding new businesses in cloud and (possibly) generative AI. As a result of these reversals, the contrast between Apple and the mega-cap cohort has become fuzzy.
So back to the question: does it make sense to price Apple in the 30x P/E or should it go back in the gutter at 10 to 20?
I would argue that the big change in perception hasn’t been the surge in earnings during Covid (see graph below). The big change is the realization that Apple is no longer about to go out of business.
How could Apple not be going out of business?
Remember that a P/E ratio in the teens is a clear signal from the market that the company is a questionable “going concern”. This is parlance indicating doubt that the company will continue in its present form..
What has changed since 2020 is that even though there were a multitude of crises—from war to pestilence—the eggs kept coming. Perhaps, perhaps, Apple was not doomed after all. In that time it managed to create 1 billion customers. Perhaps having 1 billion customers was a positive outcome. Perhaps counting iPhones during a single quarter was not the only way to value the company. Perhaps having 1 billion satisfied customers made it viable. Perhaps having 1 billion satisfied and loyal customers returning every year was interesting. Perhaps having 1 billion satisfied wealthy customers meant the end is not around the corner. Perhaps having 2 billion active devices in use was sustainable. Perhaps providing services to 1 billion customers using 2 billion devices delivered through 1 billion subscriptions made some sense. Perhaps having all this data in a linear graph made it predictable?
Perhaps. Though Apple provided updates on these figures regularly, the questions everyone asked were still on unit shipments (which Apple stopped providing.) While Services grew at double digits and 70% margins the questions from analysts on conference calls persist on the iPhone and currency or production “headwinds”. Perceptions take time to change. They are still changing.
Maybe at this point it’s time to agree that Apple’s end will not come through being easily replaced by the competition (first Windows then Android, etc.) but by having access to its markets restricted. Being the only American company to have cracked the China puzzle, it’s surely vulnerable there. And please don’t mention India.
Apple is no longer doomed because it’s too weak. It’s doomed because it’s too strong.
It seems that it’s not too hard to believe the end is still near.
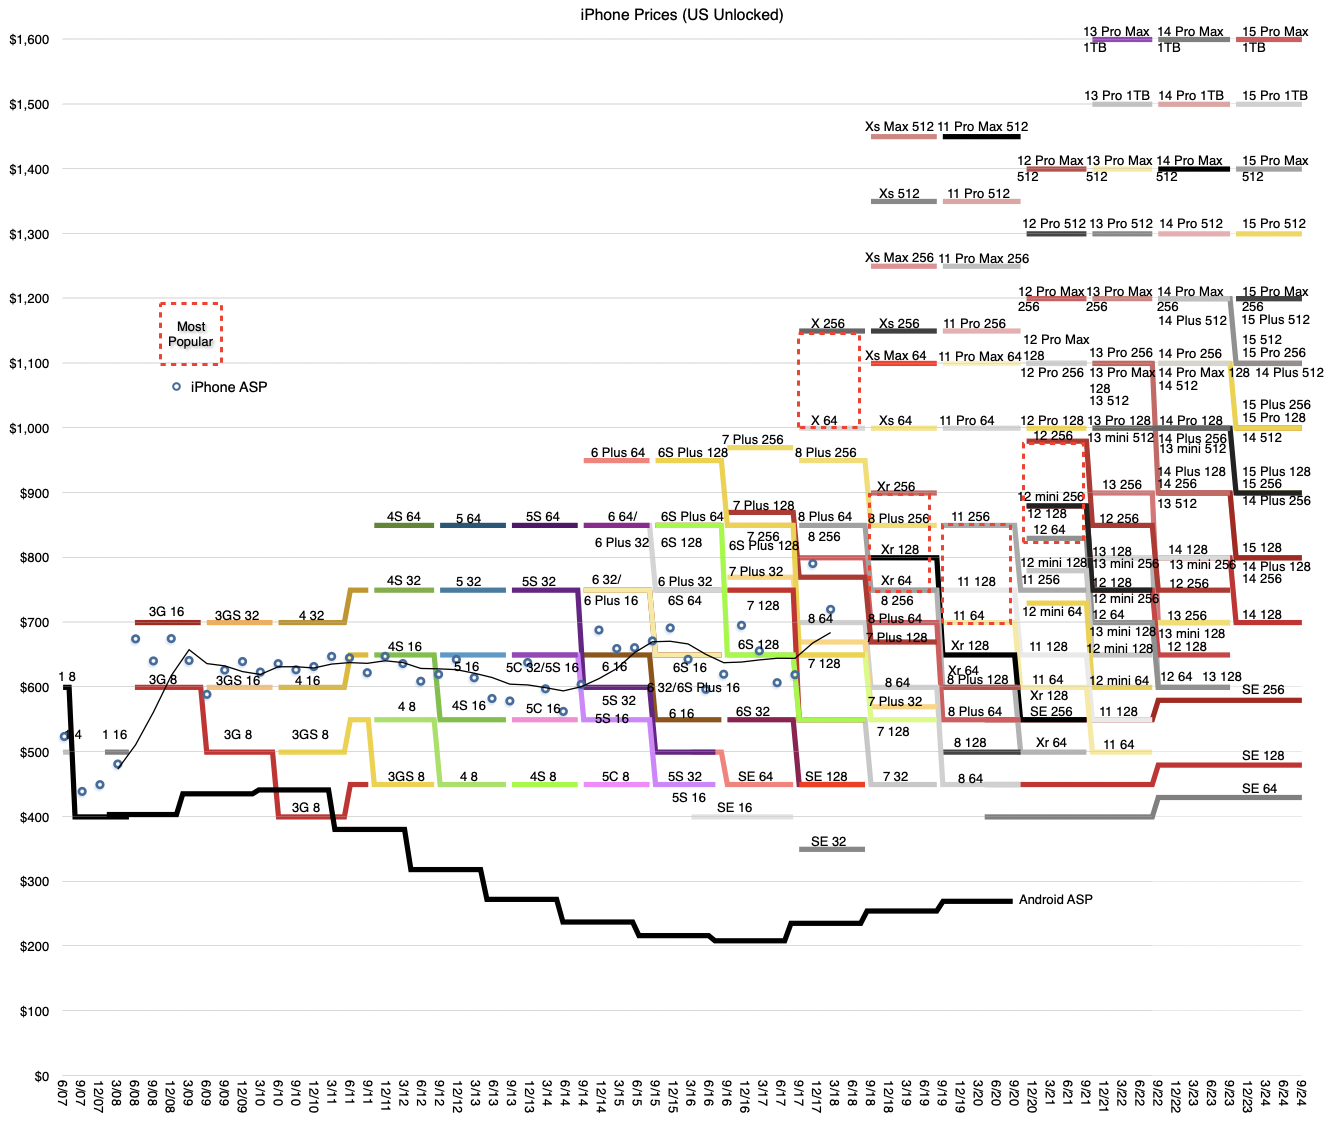
iPhone 15 has just been released and, as usual, all the products in the iPhone line-up have received new prices. The following graph shows the current product line-up (US prices before tax) and the historic price points for all the previous versions of iPhones since inception.
It was amusing before the launch to see reports that the iPhone 15 would see a price increase. If I were a betting man I would have bet against it. The reason is that, as the graph shows, pricing changes are regularly made every three years and the last one was in 2021, two years ago. It would be an extraordinary claim to expect a price increase this year.
Also, as you can see, price increases only occur when there is a new “top-of-the-line” model introduced. This new highest spec, usually, but not only, in memory, justifies the new top of the range. For instance, the top of the range in 2015 was the 6S Plus with 128GB of storage. Three years later is was the Xs Max 512GB. Three years later it was 14 Pro Max 1 TB. In nine years the top memory increased by an order of magnitude but the top size also increased as did the number of cameras. Naturally, the price increased by about $650.
Therefore we can predict with some comfort that the next “highest price” point will be $1699 for the iPhone 16 Pro Max 2TB, or equivalent. The possibility exists that the iPhone 16 Pro will also include a leap higher in optics and have more technological tie-ins with Spatial Computing.
But this highest price point is not necessarily the most common price point. Indeed, we can guess that the most common point is visible in our graph above. The density of product choices increases toward the middle of the range. The highest and lowest price points are populated with one product. The middle price points from $800 to $1,100 are populated with\ three products each. Therefore a good guess is that the $900 is likely most popular and that the average selling price is also very near there.
Note that the average sales price (ASP) has not been available from Apple since 2018. At that time the ASP was $790 (holiday quarter of 2017). A gradual increase to $900 over five years is not unreasonable. In fact, it probably should be higher given inflationary pressures. We can only guess.
We have to understand that Apple does not set pricing in response to competitive pressures, commodity pricing, inflation, currency exchange rates or internal sales or margin targets.
Pricing is sacred and is a decision made based on consumer understanding.
The anecdotes of Steve Jobs preferring certain price points because of their poetic value are legendary. 99c for a song sounds right and looks good. The iPod was priced in lovely, alliterative $100 increments. Same logic applies to services.
Pricing is an art and when you see the spectrum above you also see how the increments nudge the decision process. Pricing is a signal. It’s a conversation between seller and buyer containing information that both parties will exchange. On the part of the seller it suggests both the cost of the offering and the value it provides. Buyers are inclined to see if they can stretch to the next higher increment given the increased value proposition. Once their decisions in the collective are tallied, the seller knows well what buyers prefer.
Apple has been having this conversation for decades and it shows.
After the Apple iPhone 15 launch event of September 12, 2023 I was a guest on the Claman Countdown show on FOX Business News (FBN) and here is the video.
In advance of the event I was asked for a few thoughts that might be topics I would like to discuss.
My answer was:
Apple has been pushing hard on imaging in their iPhone evolution. It has also released the Vision Pro that offers so-called Spatial Photos and Video. There is speculation that there will be some linkage at some level with Vision Pro and iPhone imaging. I do wonder if we’ll get hints of possible new optics that can support the Spatial Photography
Remember that Apple hinted at Spatial capabilities with its iPhone Lidar sensor some time ago. Apart from better focus at night, there was little purpose for laser distance measurements in a 2D photo device.
Additional Apple Watch health features are also always interesting. Apple’s efforts in health are hiding in plain sight and point to major value proposition to a large audience that skews older.”
Based on this, I’m rather happy to see the support for Spatial Photos and Videos in iPhone 15 Pro. The surprise on the watch was not a new Health feature per se but the Double Tap interaction mode.
Also of interest to me was the Roadside Assistance via Satellite. This will be a very well received feature and many news stories will be written about it.
[The following is a post written by James Allworth.
James is the co-author of How Will You Measure Your Life?. He has worked as a Fellow at the Forum for Growth and Innovation at Harvard Business School, at Apple, and Booz & Company. It follows and builds on a discussion we had on the 56th Critical Path podcast.
You can connect directly with James on Twitter at @jamesallworth -ed]
A lot of ink has been spilled in the wake of the recent Apple Samsung patent disputes, and the legal wars see no sign of abating any time soon. The rise of Samsung’s phone business has been meteoric, and Apple is right to be concerned. But the real threat that Samsung poses to Apple has very little to do with the copying (or not) of Apple’s designs. The lawsuits have simply been a convenient (if expensive and risky) way to attempt to quash a threat that is of Apple’s own making. While there’s no doubt that Google has played a key role in Samsung’s success by handing out a free mobile operating system to pretty much anyone who wants to build one — it is actually Apple, more than any other company, that is responsible for Samsung’s present success.
How? By outsourcing as much work to Samsung as they have. And it’s impossible not to wonder whether Tim Cook’s announcement yesterday on bringing back Apple’s manufacturing to the USA is the beginnings of an attempt to rectify the problem. Continue reading “The real threat that Samsung poses to Apple”
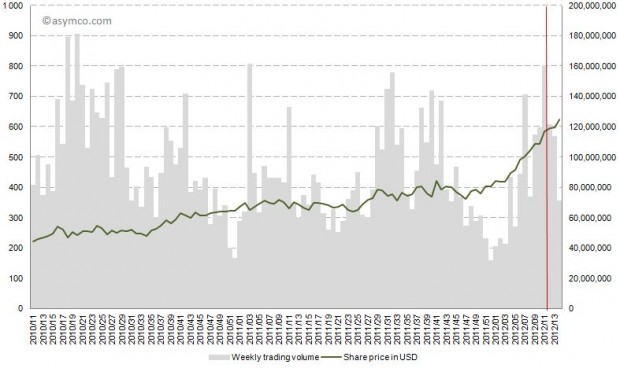
One of the arguments made for the cause of the increase in Apple’s share price of late has been that dividends would attract more institutional investors and provide more liquidity to Apple’s shares. Can we test this argument?
We’re not dealing with speculation. The decision to start paying dividends was made three weeks ago. It makes sense to assume that this new information has been absorbed by the markets and market participants have adjusted their positions. Funds that were previously restricted in their investment in Apple due to its lack of dividend policy, could now go ahead.
However, as the following chart shows, the share price climbed continuously before and after the dividend declaration of March 19th (shown in red). Trading patterns did not show unusual highs or lows. In fact, after March 19th the trading volume decreased on a weekly basis.
On October 27th, Nintendo published half year results for the fiscal year ending in March 2012. Management stated that the company lost over $900 million with a negative outlook. Nintendo cited weaker than expected sales of Nintendo DS hardware and 3DS software and Yen appreciation as the main reasons for the miss. Is this the end of Nintendo?
Before we look more closely, here is a quick summary: The company is exclusively involved in selling game hardware and software. Their console platform is the Nintendo Wii, which will be followed by the Wii U late in 2012. The Nintendo DS and Nintendo 3DS are the company’s portable game consoles. The Wii and the DS are nearing the end of their product cycles. On the software side, the company is known for gaming titles such as Super Mario and Zelda. Nintendo also pioneered the licensing model to allow third-party developers to produce games for its hardware products.
In his third “The Critical Path” podcast, Horace Dediu explained how Apple’s cash can be viewed as a strategic option, an opinion that resonated also with other analysts [1]. Cash is one of the most flexible resources as it can convert quickly into other resources such as brands, companies, technologies, people and even processes. More cash means more strategic flexibility. The large cash reserve Apple has accumulated provides high flexibility for future investments. These characteristics of cash already imply an intrinsic option value. But how big is this value?
In his recent posts Horace took a look at Apple’s fixed assets and their development over the recent years. He also tested the hypotheses that Apple is making investments into machinery & equipment on which iOS devices are produced by overlaying iOS volumes with preceding changes in property, plant and equipment (PP&E).
The question that has arisen is: Are Apple’s investments in PP&E extraordinary?
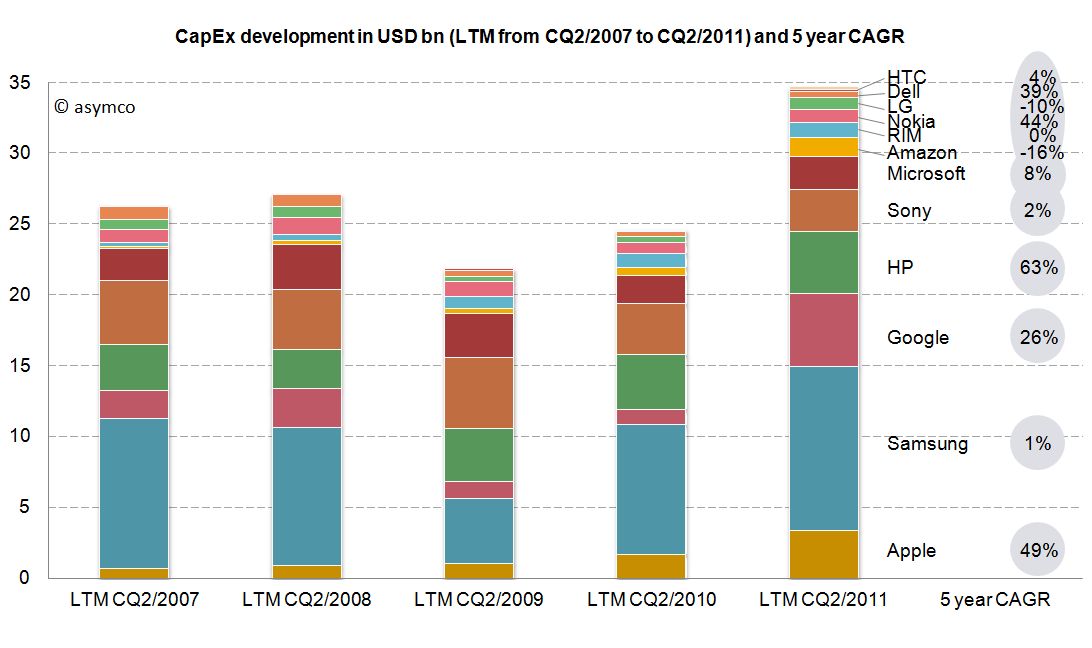
To answer, I have compiled the capital expenditures (CapEx) for our previously established peer group [1].
But first we need to clarify what CapEx include and not include. CapEx includes investment into property, plants, equipment, office furniture, larger IT hardware and in some cases patents; CapEx do not include investment into long-term marketable securities or other long-term financial instruments, acquisitions or capitalized R&D. Furthermore, CapEx are gross values and are not net of any sold equipment [2]. CapEx are largely depending on a company’s business model and strategy. For example if you are a manufacturer you need equipment to operate, if you are a software company or a retailer, your business will not be capital intensive.
As the second calendar quarter of 2011 is the latest quarter for which all companies have reported figures, we will take a look at last twelve months’ (LTM) figures from Q2/2011 backwards. The following stacked bar chart shows the combined CapEx of our peer group: