Haunted Empire

The “Stupid manager theory of company failure” (and its corollary, the “Smart manager theory of company success”1) remains the most popular, perhaps even the most universally accepted theory of management. Book after book, thoughtful article after article alludes to this theory and whenever a company is perceived to be under-performing, all fingers point to the leadership with demands for blood letting.

This is not a new phenomenon. When catastrophe strikes, as a thoughtful species, we have always asked for leaders to be sacrificed. In Europe during the Iron age leaders were sacrificed when crops failed. In South and Central America leaders were ceremonially tortured for similar reasons.

Of course most crop failures were due to weather phenomena and the anointed leadership had nothing to do with these causes. Nevertheless ancient correlation analysis would have revealed the pattern that good leadership meant good weather and bad leadership meant bad weather.

There was a balance to the downside however. When times were good the leadership enjoyed luxuries and praise. This was the essential deal societies made: we’ll keep you in riches and allow you to be idle as long as times are good but ritualistically slaughter you when times are bad. We’ll declare you “chief magical officer” and place all our faith in you. But, of course, if you fail, we will will be vengeful.

And so it goes in today’s corporate world. I’ve often said that corporate governance is medieval, or pre-scientific in its approach to understanding causality. That may be too generous. As far as the reward/punishment system (also known as Human Resources) it’s probably pre-neolithic. The luxuries and extravagance which we heap upon the leader provide abundant evidence. Leaders insist on these ironic “pay packages” and boards approve them because they know they can and will be ritualistically sacrificed if and when the mobs turn against them.

A manager would be a fool to accept even generous pay given the risk, actually near certainty, of ritualistic slaughter. They demand and are unquestionably given absurd pay that has no relationship to performance. Such pay has no relationship to performance because it isn’t designed to reward performance but to account for the risk of arbitrary and very public sacrifice. Boards (and hence shareholders) are deliberately hiring a scapegoat for sins as yet unknown. Luxury and violence are thus finely balanced in what is called “Executive Search”.

Continue reading “Haunted Empire”

  1. As well as the “Smart/Stupid leader theory of national success/failure” []

Biggest news of 2014

As corporate romances go, IBM and Apple’s must rank among the most unexpected. As I wrote on the date they changed their Facebook status, the two companies were antagonists for the better part of twenty years and their rapprochement was met with a shrug mostly because yet more decades passed since.

Screen Shot 2014-12-26 at 11.28.03 AM

Nostalgia aside, this new union is profoundly important. It indicates and evidences change on a vast scale. The companies’ antagonism was due to being once aimed at the same business: computing. Since the early 1980s, “computing” came to be modularized into hundreds, perhaps thousands of business models. It is no longer as simple as selling beige boxes. IBM was forced out of building computers and into services and consulting while Apple moved to make devices and the software and services which make its hardware valuable.

The convergence of interests which was consummated into a deal this year stems from the migration of computing around what has come to be called “mobile”. Apple intends to accelerate the adoption of its mobile platforms among the remaining non-adopters: enterprises–a group which, by now, qualifies as laggards.1 Simultaneously IBM intends to connect data warehouses at those same enterprises to their employed users.

Continue reading “Biggest news of 2014”

  1. There was a time–when Apple was young–when enterprises were the innovators, early adopters. That role ended approximately in the year 2000 []

What next, Samsung?

I received a few questions from Shirley Siluk of NewsFactor as a follow-up to my post on the trajectory of successful companies.

1. Do you foresee any hope for a turnaround for Samsung? If so, where do its best opportunities lie?

Screen Shot 2014-10-13 at 1.44.54 PM

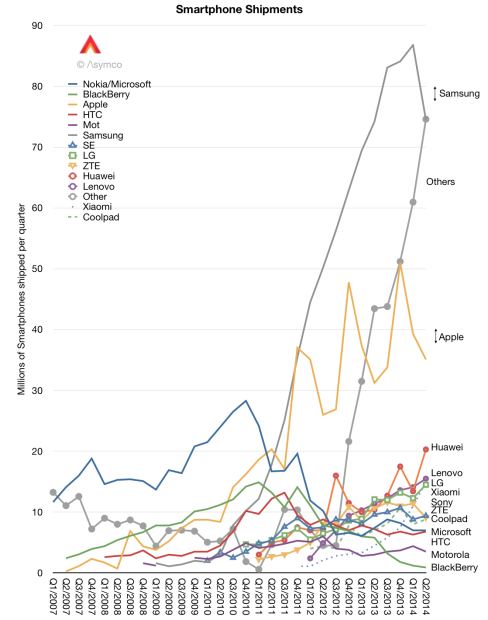
The smartphone business was a huge opportunity for Samsung and they took full advantage of it. Unfortunately, it’s a difficult business to stay on top of. The list of victims in that industry is quite long and there have been no long-term winners. Samsung’s operating model seems to be to invest as a ‘fast follower’ filling in the market after it’s established while leveraging capital intensive components synergies. That has also worked for them in consumer electronics (at the expense of Sony and other Japanese vendors). If the modus operandi does not change then their turnaround will depend on the creation of new opportunities/categories. Wearables may be such an opportunity but it may not be as big as the phone business.1

2. What has contributed most to Samsung’s decline? Which competitors are posing the greatest threat?

Continue reading “What next, Samsung?”

  1. The graph shows estimates of smartphone shipments for a select number of vendors. []

Tentpoles

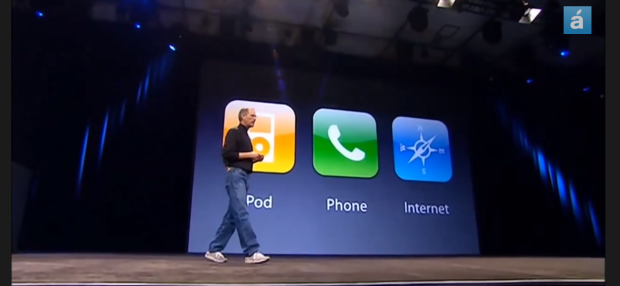
When the iPhone launched, Steve Jobs introduced it as being three products in one:

  • A wide-screen iPod
  • A phone
  • A breakthrough internet communicator

Screen Shot 2014-09-11 at 2.40.54 PM


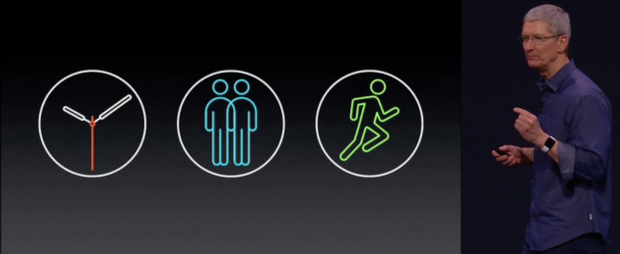
When the Apple Watch launched, Tim Cook introduced it as being three things:

  • A precise timepiece
  • A new, intimate way to communicate
  • A comprehensive health and fitness device.

Screen Shot 2014-09-11 at 2.37.52 PM

Continue reading “Tentpoles”

Revolutionary User Interfaces, Part 2

In 2011 I wrote:

My hypothesis is that The Primary Cause for the shift of profits from Incumbents to Entrants has been the disruptive impact of a new input method.

It was a description of what I considered to be the “disruptive technology” which caused incumbents which had a “front-row seat” to the future of their industry to be completely displaced and marginalized by an entrant1 with no discernible right to do what they did.

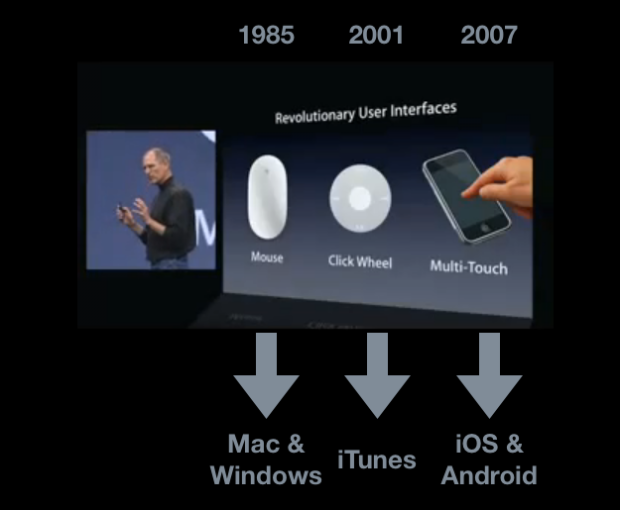
I illustrated what underpinned the sea change in the phone business via the slide that Steve Jobs used in the iPhone launch event:

Screen-Shot-2011-11-03-at-11-3-10.45.20-AM


I added the years when each input method was introduced and the  platform/ecosystems created as a result. These new ecosystems were the primary cause for dramatic industry-sized shifts in profits.

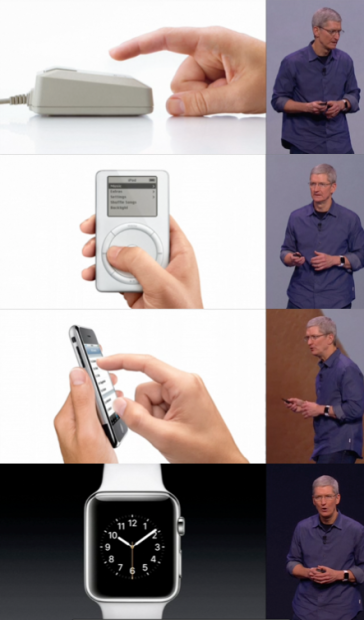
Not coincidentally, during the 2014 Apple Watch launch, the presentation began2 with a re-telling of the “mouse, click wheel and Multi-Touch” story.

Screen Shot 2014-09-10 at 10.07.55 AM

Seven years later, the difference is that there is a new object added to the story. It answers the question that has been on my mind since that first post on revolutionary user interfaces was written: what will come next.

Now that we have an answer, the next step is to understand the new platform, its ecosystem; which industry will be affected and which incumbents will be displaced and to what degree will value be created beyond that which will be displaced.

Piece of cake.

  1. later more than one []
  2. Begins one hour into the 2 hour downloadable video []

Is the PC back?

Gartner’s own press release has an interesting spin:

“After Two Years of Decline, Worldwide PC Shipments Experienced Flat Growth in Second Quarter of 2014, According to Gartner”

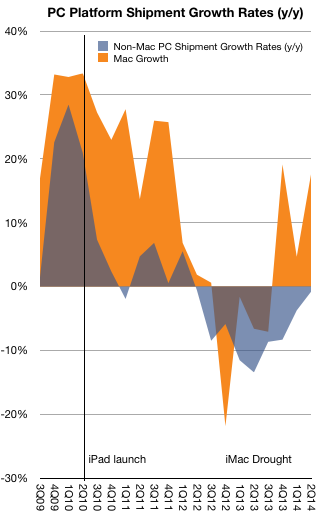
Gartner’s actual figure is 0.1% growth. Gartner and IDC measure slightly different quantities as “PC” but they don’t disagree much. IDC still shows declining PC sales at about -1.7%. However both also include the Mac in their accounting of PC. If we were to remove the Mac and measure “Windows PC”1 Gartner’s figures would show -0.8% drop in PC ex-Mac shipments.

The difference in growth between the Mac and non-Mac PCs is shown in the following graph.

Screen Shot 2014-07-23 at 7-23-5.23.08 PM

As Apple puts it, the Mac grew faster (and hence gained share) for 31 out of the last 32 quarters.  It missed on this perfect record during the fourth quarter of 2012 when the then fresh new iMac was impossible to buy due to production issues.

So as far as the Mac is concerned the slowing of the decline in PC unit shipments isn’t at its expense. Continue reading “Is the PC back?”

  1. In quotes because this total includes Linux and Chromebook []

IBM and Apple: Catharsis

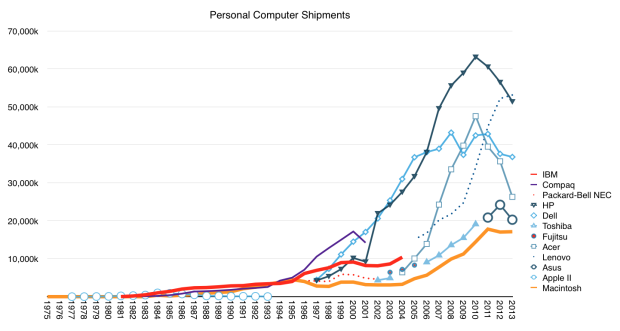
IBM did not invent personal computing but their “PC” became synonymous with the category. Having entered the market in 1981, the IBM PC quickly became the top selling brand. From 1984 to 1993 IBM sold more PCs than any other vendor, conceding the spot to Compaq which remained on top only until 2000. No PC vendor remained at the top of the sales leagues longer than IBM. HP had the second longest run but that run was broken last year as Lenovo (who acquired IBM’s PC business) surged.

Screen Shot 2014-07-16 at 4.19.11 AM

As the graph above shows, the period of time when IBM was dominant was characterized by far lower volumes. In 2004, the year IBM exited, they sold about 10 million units. ((as the graph shows, if we consider Lenovo as taking over from there, they did a very good job extending the legacy.)) It was a decent performance but one that did not keep up with the Dell and HP/Compaq race to the bottom in pricing and subsequent rise in volumes.

However, throughout its position of strength, IBM was a reluctant PC maker. Continue reading “IBM and Apple: Catharsis”

Measuring Not Getting the Cloud

This is what “Not getting the Cloud” looks like:

Screen Shot 2014-05-09 at 5-9-3.30.03 PM

Screen Shot 2014-05-09 at 5-9-4.04.33 PM


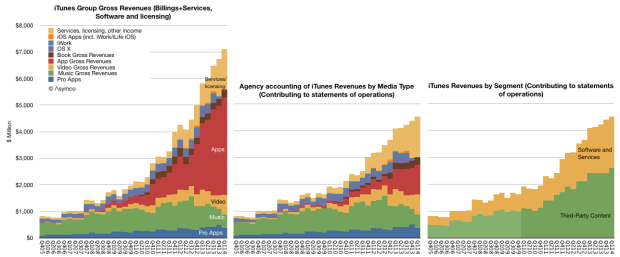
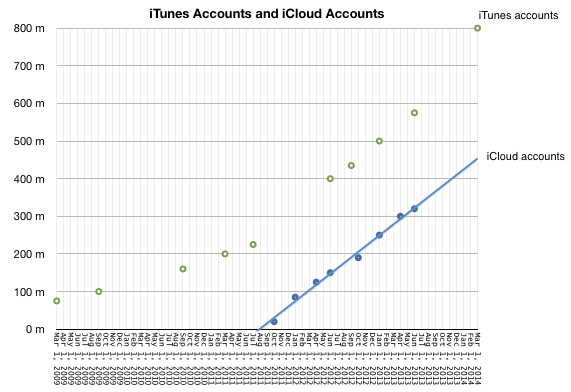
“Not getting the cloud” means that in the last 12 months Apple obtained:

  • 800 million iTunes users and
  • an estimated 450 million iCloud users spending
  • $3 billion/yr for end-user services plus
  • $4.7 billion/yr for licensing and other income which includes
  • more than $1 billion/yr paid by Google for traffic through Apple devices and
  • $13 billion/yr in app transactions of which
  • $9 billion/yr was paid to developers and
  • $3.9 billion/yr was retained as operating budget and profit for the App Store. In addition,
  • $2.7 billion/yr in music download sales and
  • more than $1 billion/yr in Apple TV (aka Apple’s Kindle) and video sales and
  • $1 billion/yr in eBooks sold

In summary, iTunes, Software and Services has been growing between 30% and 40% for four years and is on its way to $30 billion/yr in transactions and sales for 2014.

This is what can be deduced from a reading of Apple’s financial statements of operations. If there are comparable details for companies which do get the cloud, I’ll be happy to tally the comparison so we can calibrate this failure.

Inventive Teens

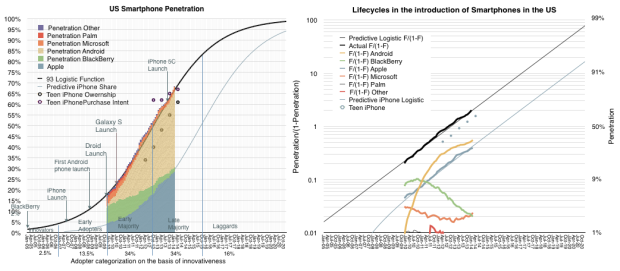
Philip Elmer-DeWitt cited Piper Jaffray’s latest Teen Survey on Device Ownership where ~7,500 teens in the US are asked about their device ownership. This type of data is similar to the method comScore uses to measure penetration smartphones in the US making the two data sets comparable.

The combined data is shown the following graphs.

Screen Shot 2014-04-10 at 4-10-3.07.04 PM

One graph is the penetration data and the other is the ratio of penetration to unpenetrated on a log scale. The PJC Teen Survey data is shown as dots on both graphs. In the spring of 2012 the difference between teen iPhone ownership and overall population iPhone ownership was 20 percentage points. In the fall 2012 it was 22 points. In spring 2013 it was 25 points. The spread increased to 30 points in the fall of 2013.

Continue reading “Inventive Teens”

When Apple reached parity with Windows

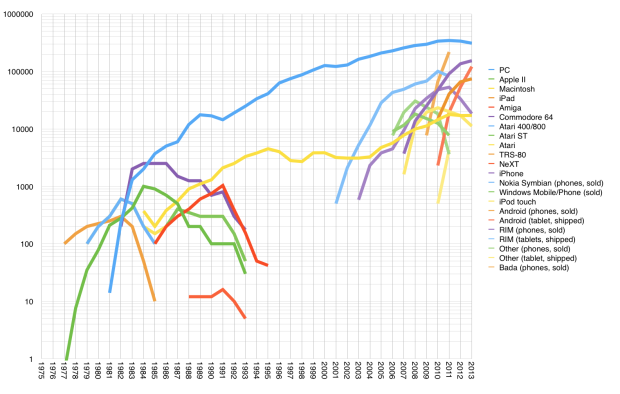
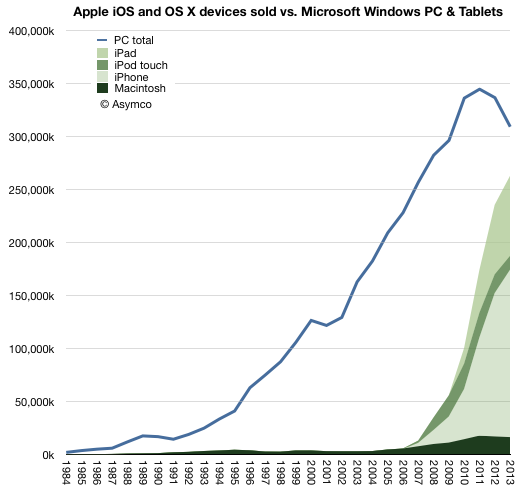
In 2013 there were 18.8 times more Windows PCs sold than Macs. This is a reduction in the Windows advantage from about 19.8x in 2012. This decline is mostly due to the more rapid decline in Windows PC shipments relative to the more modest decline in Mac unit shipments. Gartner estimates that about 309 million Windows PCs were shipped,1 down from 337 million in 2012 (which was down from 344 million in 2011, the year PCs peaked.) I estimate about 16.4 million Macs were shipped in 2013 down from 17 million in 2012.

The history of PC shipments relative to Mac shipments is shown in the following graph:

Screen Shot 2014-01-13 at 1-13-3.09.21 PM

I chose to graph the Mac data as an area with additional areas for iOS devices layered on top.

Continue reading “When Apple reached parity with Windows”

  1. This figure is not published publicly but can be derived from subtracting Mac shipments from the total PC shipments which are published []