For more analysis of Apple & the industry, join us at ACTIVE 2025.

The Bank of Apple: Using capital to ensure additional capacity and supply

When I wrote suggesting that the “best use of cash” was not acquisition but integration of manufacturing under the Apple control umbrella, the rumor that set off that discussion was that Apple was financing new facilities for its suppliers.

Those rumors were quashed, but we now know there is something to them.

During the September and December quarters, we executed long-term supply agreements with three vendors through which we expect to spend a total of approximately $3.9 billion in inventory component prepayments and capital expenditures over a two-year period. We made approximately $650 million in payments under these agreements in the December quarter, and anticipate making $1.05 billion in payments in the March quarter.

Apple Management Discusses F1Q11 Results – Earnings Call Transcript – Seeking Alpha [my emphasis] Continue reading “The Bank of Apple: Using capital to ensure additional capacity and supply”

Estimates for Apple’s second quarter earnings (ending March)

Apple’s CFO guidance statement:

We expect revenue to be about $22 billion, compared to $13.5 billion in the March quarter last year. We expect gross margins to be about 38.5%, reflecting approximately $50 million related to stock-based compensation expense. We expect OpEx to be about $2.35 billion, including about $250 million related to stock-based compensation. We expect OI&E to be about $50 million, and we expect the tax rate to be about 25.5%. We are targeting EPS of about $4.90.

via Apple Management Discusses F1Q11 Results – Earnings Call Transcript – Seeking Alpha.

This is a particularly aggressive revenue growth forecast of 63% (note again that Apple’s P/E has dropped to 18 and 14 ex cash and 10 on a forward basis) . Since Apple always guides very conservatively, the likely figures for the top and bottom lines are likely to be higher.

How much higher? Here are my estimates (growth in parentheses is year over year).

  • iPhone units: 18.4 million (110%)
  • Macs: 3.62 million (23%)
  • iPads: 6 million
  • iPods: 10.1 million (-7%)
  • Music (incl. app) rev. growth: 25%
  • Peripherals rev. growth: 23%
  • Software rev. growth: 23%
  • Total sales: $24.5 billion (82%)
  • GM: 38.8%
  • EPS: $5.89 (77%)

Looking a bit further ahead, earnings suggest the company is now trading at a forward P/E of about 9.5.

The end of exclusivity doesn't change the price operators pay for the iPhone

AT&T does not pay a higher price for iPhone exclusivity | asymco.

At the risk of repetition, there are three instances in conference calls that Apple management has stated that the iPhone has a fixed price for all operators and resellers.

The first was in October 20, 2009:

“So when you go from exclusive to multiple, you don’t change the charge to the carrier?”

Cook answered: “Correct.”

The second was a year later, October 18, 2010: Continue reading “The end of exclusivity doesn't change the price operators pay for the iPhone”

How exclusivity distorted the US smartphone market

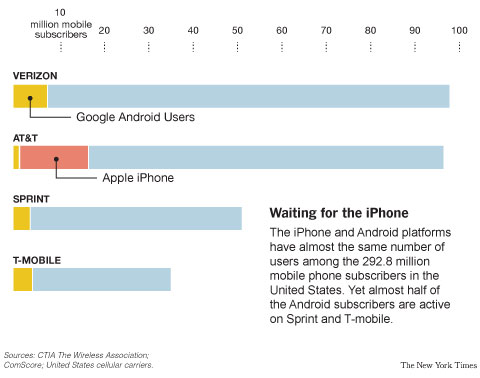
Here’s a wonderful chart from The New York Times:

Will Apple Put the iPhone on Other Carriers? – NYTimes.com.

Although the population of Android users is near in size to the population of iPhone users, the concentration in one carrier shows how distribution agreements hamstring platform choice. Continue reading “How exclusivity distorted the US smartphone market”

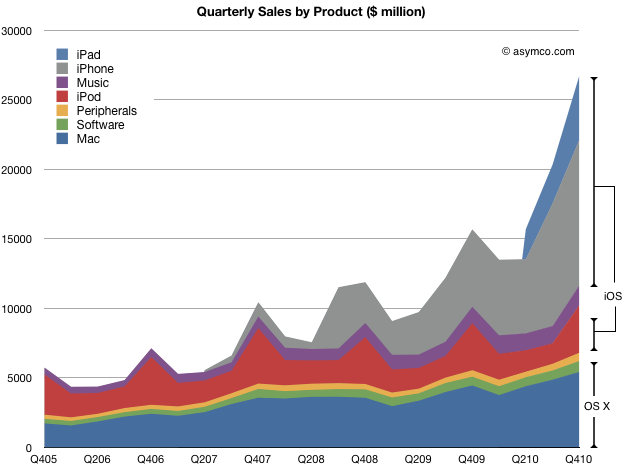
65% of Apple's sales came from iOS powered devices

The iPhone and iPad generated $15 billion of revenue last quarter. In addition, iPod touch generated about $2.3 billion, implying that iOS based devices were responsible for sales of $17.3 billion.

To put that in perspective I drew this chart which shows not only the sales by products but a rough representation of share of the two OS variants Apple uses to power its products.

Continue reading “65% of Apple's sales came from iOS powered devices”

Why Eric Schmidt had to go: Google's innovation dilemma

Charles Arthur provides a convincing back-story to the Google exec re-shuffle.

Google shuffle: why Eric Schmidt had to be pushed from the top | Technology | guardian.co.uk.

There is evidence of execution failure and indecision or muddled messages to stakeholders. Shared leadership arrangements never end well.

But in this forum I’ve been critical of their strategy. Though I’ll be the first to admit that such criticism is not founded on data but on intuition, strategy is always made in a vacuum of data. It is just an unfortunate fact of life that we don’t have data about the future.

But what data we do have is about the past and it shows the contrast between Apple and Google.

As a sample, let’s look at the performance in the last quarter: Continue reading “Why Eric Schmidt had to go: Google's innovation dilemma”

Reminder: @asymco on Twitter

There are many thoughts which are not substantial enough to be posted as blog entries. There are also questions that need to be asked or answered which are not yet ‘baked’ enough to be cast into a permanently linked posting.

For these reasons and for the simple fact that it’s fun, I am using Twitter more frequently. Since I know not everyone has or wants an account, my twitter feed is now shown in the second (right-most) sidebar. It’s limited to the last eight tweets.

For those who would like to keep the discussion going in this new medium, my Twitter app (from the Mac apps store) is always running.

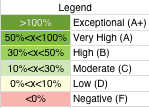
Apple's Growth Scorecard: 63% average earnings growth over 16 quarters

In the last quarter Apple’s top line grew by 70% and the bottom line by 75%.

For a historical perspective, the following table shows year-on-year growth for products[1] and sales/earnings color coded with an arbitrary scoring range.

Continue reading “Apple's Growth Scorecard: 63% average earnings growth over 16 quarters”

A new era in financial analysis is dawning

The story of amateur out-performance has been getting more attention lately and that’s a good thing. Success emboldens more amateurs to try their hand at financial analysis. Transparency of methods and data demystifies a practice that is not as complex, and a skill that is not as hard to obtain, as it’s often assumed.

While, quarter after quarter, the gap between the two cohorts is calibrated, what we haven’t heard much of is a defense from the professionals.

That’s a bit strange given the negative impact some of the attention must be having on their reputations. This is why I was glad to see that Adam Satariano’s well-written piece finally got some reactions from the professionals. Continue reading “A new era in financial analysis is dawning”

Unforeseeable growth: Analyst failure on iPad as indicator of disruptive change

Professional analysts’ first year iPad unit forecasts (sourced from TMO Finance Board)

Asymco

Asymmetric Competition

Skip to content ↓