For more analysis of Apple & the industry, join us at ACTIVE 2025.

Asymcar 6: Peak Horse

IMG_8345

Asymcar 6: Peak Horse | Asymcar.

Steve Crandall brings a new perspective as a guest. Steve’s analysis of complex systems has given him a huge pool of wisdom into which we dip our dainty spoons.

We survey the interlopers seeking to replace many jobs that cars have traditionally done, from horses to bicycles, planes, trains and buses.

We dive deeper into a few earlier Asymcar topics including energy, regulation, infrastructure, power train evolution, societal changes, distribution networks, urbanization and consider the promise of electric bicycles.

Several innovation timing lessons temper our expectations for immediate improvements.

Finally, we revisit the emerging transportation information layers and how such services may change public behavior and the auto-ecosystem.

Asymcar 6: Peak Horse | Asymcar.

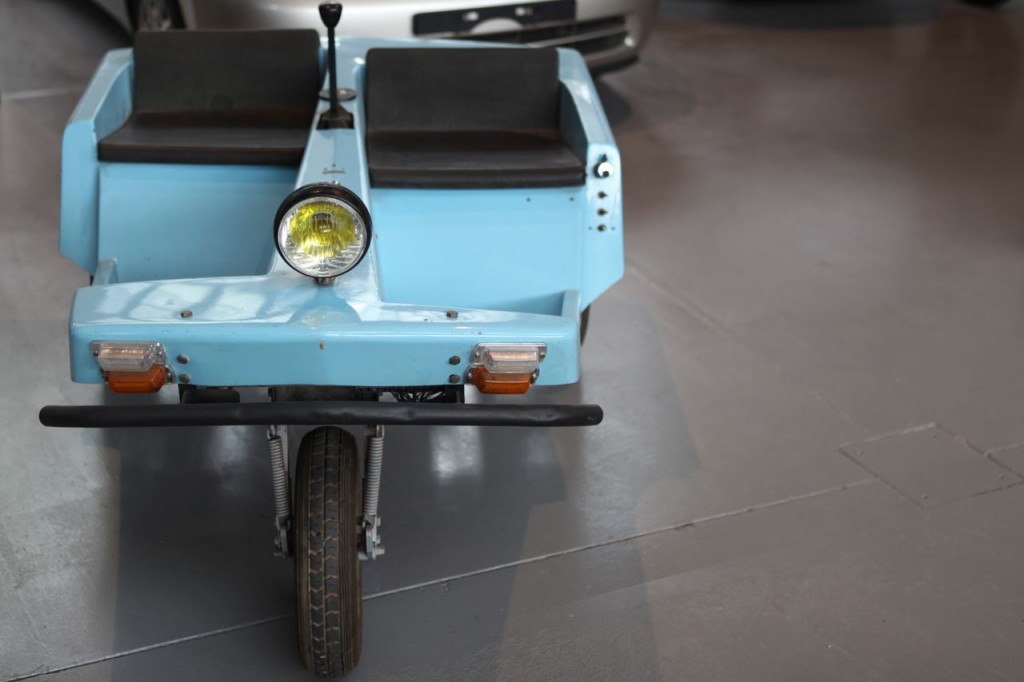
(Honorable mention to anyone who can identify the vehicle shown above.)

Cinematic

Screen Shot 2013-10-18 at 8.04.50 AM

Cinematic is to film as Literary is to prose. It’s not a measure of quality or of beauty. It’s mainly the application of technique to impart an additional layer of meaning to the writing, performance and direction of the medium. Cinematic technique lifts the viewer to another, more profound point beyond the literal.

Whether it’s film, literature, verse, stagecraft or other visual arts, techniques vary but they have the same purpose. They make the audience feel more than what is said.

The quality of a good work of art is that it tells a truth without saying it.

And this, I believe, is what the analyst should also strive for. It is at least what I try to do and, having practiced for a while, I think I can convey some of the techniques I learned.

We don’t have a better word for describing these techniques than “cinematic”. They allow the presenter of complex and rich data to convey meaning with an economy of rhetoric. They draw the audience into completing the picture thus making it their own. They persuade without pleading. They teach without lecturing. They create, in a way, a poetic language for data that combines techniques from several arts, especially cinema.

The means for teaching this is a workshop called Airshow.

Together with IBM, we are proud to bring Airshow to Boston, New York and Helsinki this year.

Register here.

The iPhone company

The analyses of adoption of smartphones in the US and EU5 are remarkably consistent with each other. They also turn out to be consistent with the valuation of Apple.

Screen Shot 2013-10-17 at 10-17-4.01.35 PM

I show the stages of adoption overlaid with the derivative of the Logistic Function and Apple’s enterprise value. The derivative of the Logistic Function shows the speed of adoption, peaking at the inflection point when adoption ceases to accelerate and begins to decelerate. Continue reading “The iPhone company”

The Critical Path #98: Kicking and Streaming

Horace and Moisés look beyond Apple’s rumored “watch” project to contemplate the real reasoning behind recent executive acquisitions from the world of high fashion (and what it signals). Is Apple now driving “lifestyle” more forcefully than ever? We examine redefinition, from public face to product, and Mac Pro to (possibly) iPod nano.

via 5by5 | The Critical Path #98: Kicking and Streaming.

When will the European Union Five reach smartphone saturation?

Thanks to Symbian, the EU5 countries (France, Germany, Italy, Spain and the UK) had an earlier start in the conversion of phone usage from non-smart to smart devices. According to published comScore data, in July 2010 the EU5 were at 26.6% penetration of smartphones and the US was at 22.8%1.

However, with the aid of mobile operator subsidies, by the beginning of this year, the US caught up. According to comScore EU5 reached 57% penetration in March 2013 while the equivalent figure for the US was 58%.

Using the logistic curve model introduced last week, it’s possible to get an approximate categorization of the adopters of the technology:

Screen Shot 2013-10-16 at 10-16-2.02.44 PM

As with the previous analysis, the graph identifies the following dates: Continue reading “When will the European Union Five reach smartphone saturation?”

  1. The population is defined as adults using phones for themselves. Meaning it excludes children and phones purchased by companies. []

Announcing Next Airshows: Boston, New York and Helsinki

Airshow New York was our best Airshow ever. We sold out to an audience who engaged and challenged us to our best performance. We are learning more each time and after three shows we have honed the show to a fine performance.

Due to the demand met in New York we decided to return there in December 5th but to also present in my home town of Boston on December 3rd. We are also presenting in my second home town of Helsinki in November.

You can sign up for any of these events at Airshow.asymco.com.

The purpose of Airshow is:

  • To explain how to present rich data in a compelling and emotionally engaging way.
  • To explain the principles of visual persuasion.
  • To offer hands-on training with the tools of persuasion: iPad and  Perspective.

The method we devised borrows heavily from the techniques of Cinematography and screenwriting to impart meaning to the audience beyond the literal words spoken or images shown on screen.

This includes:

  • Framing
  • Light and Color
  • Depth
  • Motion
  • The Reveal
  • Texture
  • Establishment
  • Characterization
  • Point of View

These techniques are demonstrated with “feature presentations” and then deconstructed in interactive lectures. Throughout we also weave Aristotelian rhetorical tips and present from the Asymco repertoire of stories.

The day ends with a hands-on exercise. iPads are required.

At the end of the seminar you should be able to:

  • Understand how data can be used to persuade through an appeal to logic as well as through empathy.
  • Understand the basics of “data cinematicism” including the techniques analogous to cinematography and direction.
  • Understand story development techniques including how to facilitate the audience’s entry into the story.
  • Build a cinematic presentation.

We are looking forward to seeing you at the next Airshow.


Asymcar 5: A Faster Horse

Asymcar 5: A Faster Horse.

Of Phaetons, Coupés, Shooting Brakes, Broughams, Hackneys, Cabriolets, Landaus and Limousines. Horace and Jim step back in time to revisit the raison d’être for carriages and the emerging “horseless” carriage. We explore how evolution rather than revolution of networks influenced the technologies of transportation.

The question of foothold markets comes up and we explore which jobs-to-be-done affected early car design. The leap from these early jobs to the modern segmentation of the market is observed through the contrast between Henry Ford’s approach to the then agrarian market compared with Alfred Sloan’s portfolio strategy at General Motors.

The discussion morphs into a brief infrastructure review where the development of roads is compared to today’s telco operator business and regulatory models.

Finally, Horace and Jim drift into insurance and discuss the risk pooling implications of driverless cars.

Asymcar 5: A Faster Horse.

The Five Year Plan

Gartner reported that PC shipments totaled 80.3 million units in Q3. Subtracting an estimated 4.4 million Macs yields an estimated 75.9 million Windows PCs.1

This total is lower than the total shipped in the same period of 2008.


Screen Shot 2013-10-10 at 10-10-11.12.11 AM


The graphs above show the Continue reading “The Five Year Plan”

  1. The total will be less than this as some PCs will not ship with Windows []

How many smartphone users will there be in the US?

In yesterday’s post forecasting smartphone penetration I neglected to mention the exact subset of the US population being sampled. The analysis is based on comScore’s sampling which covers only those devices which are the “primary phone” for users  over 13 years old and not provided by an employer.

In other words, the population being sampled is not meant to identify how many phones will be in use but rather what is the primary phone for those non-children who choose their own phones.

So the measurement that can be obtained from the S curve analysis is a subset of all phone users and will not identify exactly how many phones will be in use. Given that, this is what that subset looks like:

Screen Shot 2013-10-08 at 10-8-9.41.00 PM

I drew a line showing the census data (and projection) for the US population and estimated what percent of that population might be Continue reading “How many smartphone users will there be in the US?”

When will the US reach smartphone saturation?

The latest comScore data places penetration at about 61%, up over 10 percentage points from the same time last year. The 50% last year is itself up nearly 14 percentage points from the same time in 2011. This progress in the diffusion of smartphones is shown the following graph:

Screen Shot 2013-10-07 at 10-7-5.32.48 PM

I set the time frame for the graph to start in 2005 because there was still a market at the time. We can estimate the number of users from data supplied by Continue reading “When will the US reach smartphone saturation?”

Asymco

Asymmetric Competition

Skip to content ↓